Code Review for Dummies
Viren Punjabi
Apr 17, 2024
•
6 Min
Viren Punjabi
Apr 17, 2024
•
6 Min
Okay, so you have taken up a code review project and now you are sitting confused and scratching your head figuring out the meaning of what’s being displayed, Seems like too much to take in. Well Let’s figure this out and master the skill to review any source code.
Code review is not just reading all the lines one by one and going through all the files one by one, It’s about figuring out what files are connected to each other and what functions are being called when needed. It’s all about observation, understanding the logic and developing your judgement on what’s going on during code execution.
Let’s take a deeper dive into the process of doing a code review and master the skill required. It’s not as daunting as it may seem in the beginning; Trust me !
Disclaimer: This blog post is provided for educational purposes only. The techniques and information discussed are intended to enhance understanding of security concepts and practices. The author does not condone or encourage any illegal or unethical activities. The reader is solely responsible for how they choose to use the information presented. The author accepts no liability for any misuse or consequences arising from the application of the techniques described in this blog post.
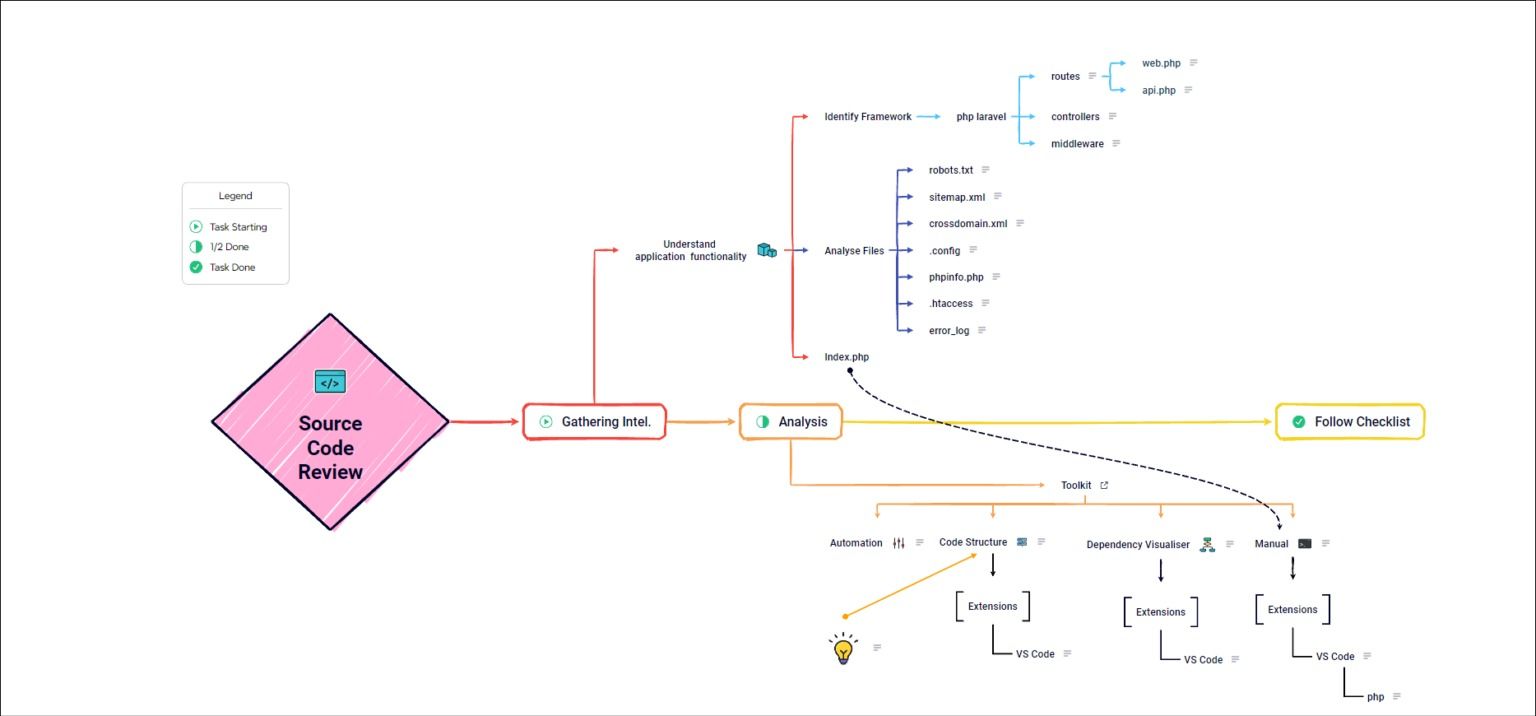
As always, let’s start by understanding the target application. We will take an example of an ecommerce website (cannot reveal name for obvious reasons). So, being an ecommerce website we can pretty much figure out how the site is functioning and what sort of activities are to be expected. Functionalities such as login or signup are expected, interacting with different items, Adding details (text or uploading files), interacting with cart and so on.
Once that’s done, we now need a starting point to start to see the code, we can’t just open random files and start reading the code. Identify the framework used by the application, look for vulnerabilities related to that framework as it will help you with better understanding of application and help you narrow down your scope making it seem less complex.
You should also look for robots.txt, sitemap.xml, crossdomain.xml, .config files, phpinfo.php, .htaccess, error_log; these are some common files each guiding us on how to prepare our environment when manually analyzing the code.
These files help in figuring out website structure, show us metadata that may help us understand some other aspects of application, what languages and frameworks are being used etc. We now know that our target is PHP based application, this is important because this will help us create a roadway to uncover the secrets hidden in the code. Once that’s all figured, we are now ready to start analyzing our target. Also do note that any misconfiguration found can be a finding and should not be neglected.
Also keep an eye out for index.php, we will use this in coming stages.
Caution: Choose the tools and extensions (required by the tools) wisely as we are dealing with critical information, and therefore use of any tools which aren’t trusted, or seems dubious may have some serious consequences are strictly prohibited.
Let’s start by using some automation tools like SonarQube or Snyk Code Scanner. Using automation has its ups and downs. This technique is not reliable as it will give false positives most of the time, which is not important but still helpful to figure out possibilities and help us narrow down our scope. It will help in accelerating our research and give some more insights in understanding application functionality.
One thing it will provide is quick reference to sensitive information being disclosed such as hard coded credentials and keys.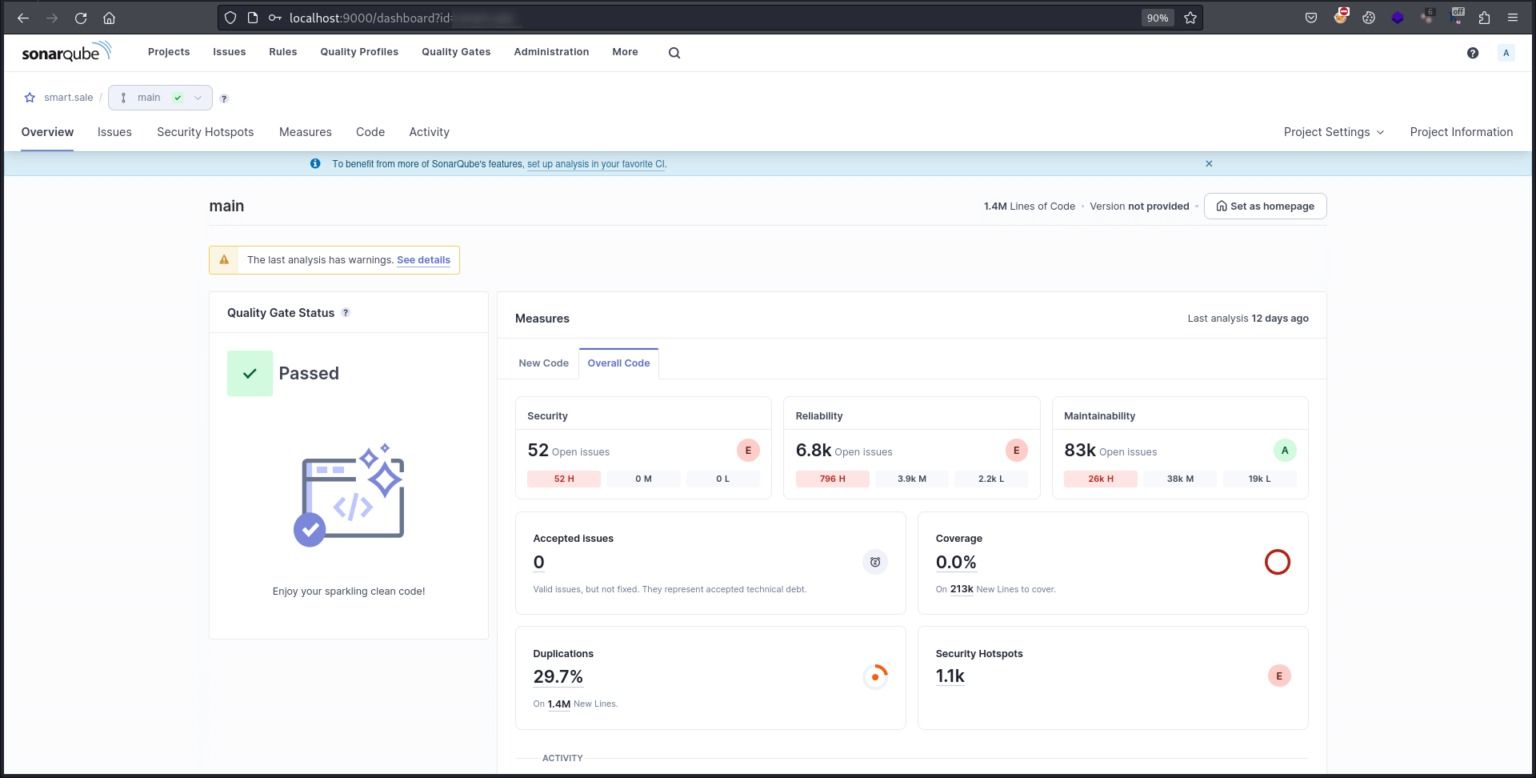
You can also do a semi automation where you can use some extensions (White Source Advise or Sync Security) in VS Code to analyze the code and help you with possible test cases in how a snippet is vulnerable.
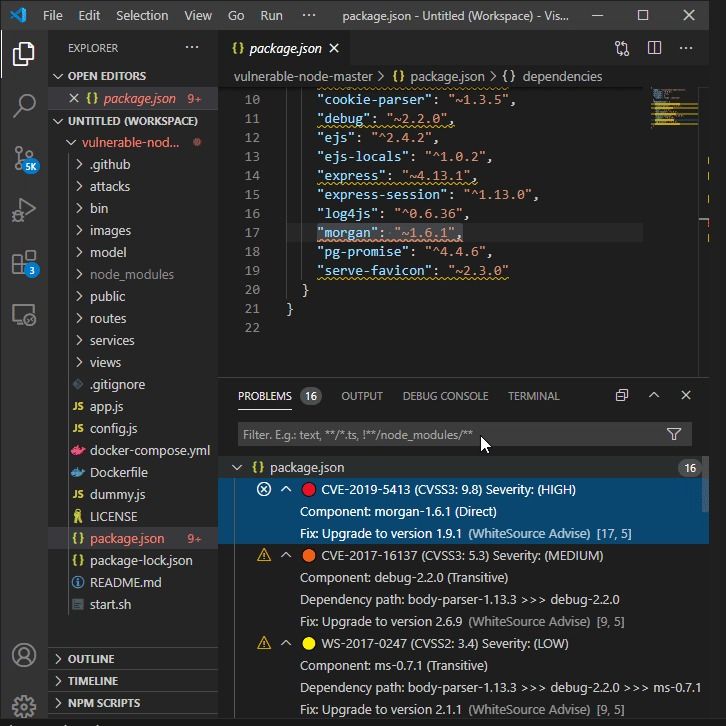
It’s always recommended to manually cross verify the results and do research on how the tool came to that particular conclusion. Keep the judgement in mind though.
Not all results are false positives.
Now, we have enough analytics to manually approach the code and do some brainstorming. Let’s further bifurcate manual analysis into three stages.
We now need to understand the code structure manually by observing the files with relation to how they are being called. We also need to understand the link between the functions that are called in respect to the action being performed. We also figure out where functions are defined and what libraries are being used. VS Code with required extensions or Sublime Text editor are the go to tools to do code review.
Tools like Tokei in windows or SCC in Linux will also come handy to gather a head count on no. of lines, codes, blanks are other parameters being used. They are helpful in reporting code statistics.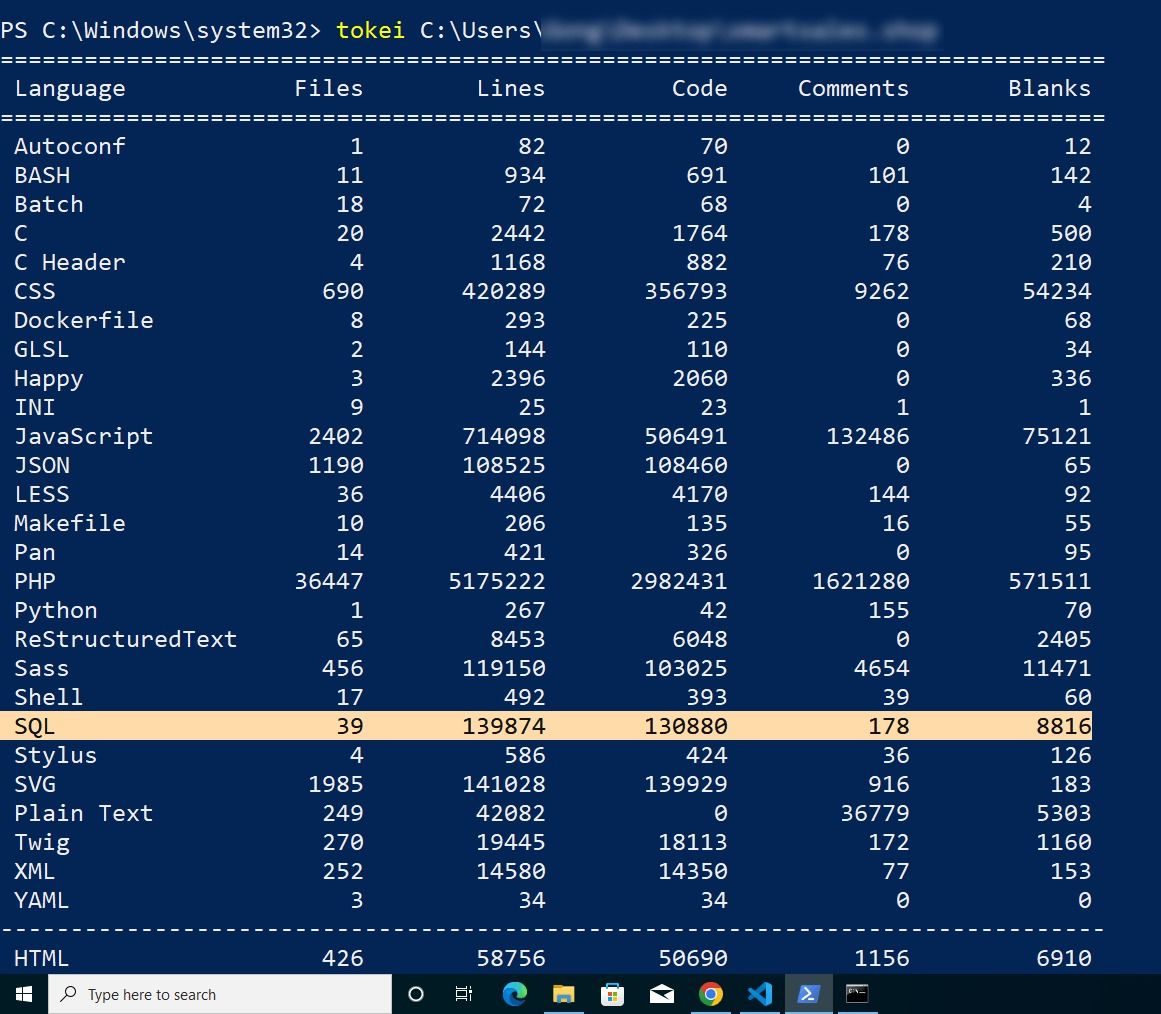
Once you have figured out the functions used in the application, do some research on known vulnerabilities for those functions. That’s a finding worth reporting !
Bonus Tip:
Make a list of files and functions being used and observe if there are any rules defined such as blacklist or whitelist filtering, if so then try to simulate the scenario to further confirm your judgement.
This is the stage where we have to start mapping out the code. Connect the dots, Understand the link and where the function is being called where it’s leading to. This will help us analyze the report generated by the automation tools, helping us decide the confidence of vulnerabilities and how to manually analyze them.
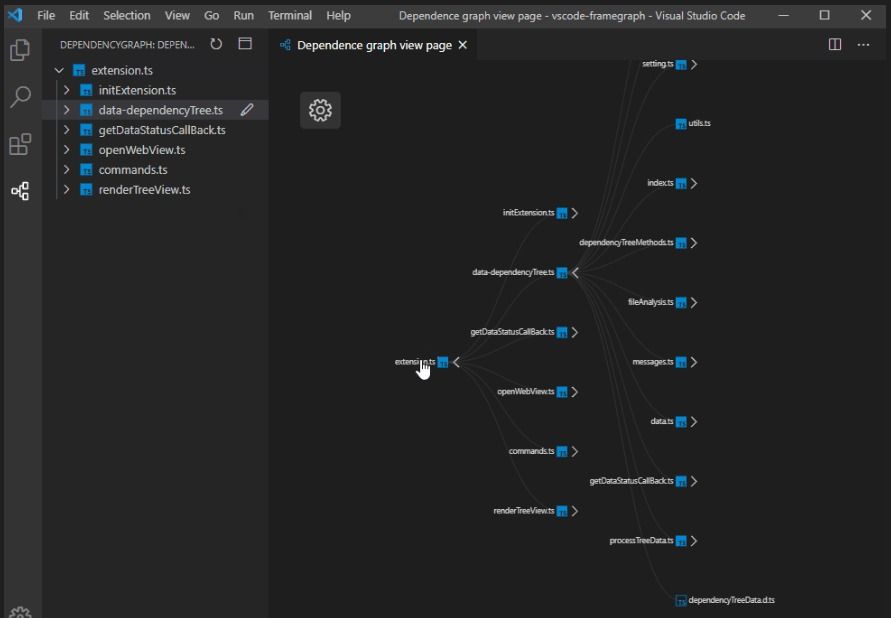
We are now ready to manually review the code, but still the question hasn’t been answered clearly regarding the starting point. Remember that index.php file, that’s your starting point. Go through the code and observe the structure. With the preparation and analytics done earlier you should now be able to figure out business logic vulnerabilities and it should be pretty straight forward to figure out technical vulnerabilities such as SQLi or XSS. I am not going deep in ‘how to identify’ a vulnerability cause I am assuming you are already familiar with web application logics. Debugging tools (PHP Debug or Debug or PHP Interphase)can come in handy here.
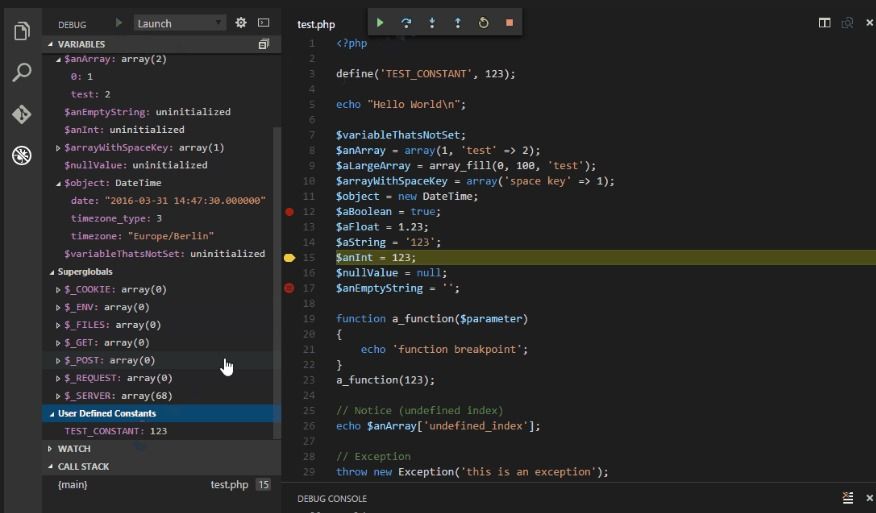
You can follow a checklist with a predefined list of vulnerabilities and behaviors as a list to focus on while analyzing the code. This will help you develop a perspective on possibilities during assessment of the code.
You now have enough findings to consider and are now ready to generate a report. It wasn’t that hard now, was it ? This guide was focused on helping you understand the methodology on how to perform a code review and can of course vary depending upon the target type. With that being clarified let’s end this blog and hope that you might have learned something new.![]()
Share