What is ElectronJs?
The Electron is an open-source desktop application framework. You might be wondering what’s special with Electron JS. The key takeaway is that you won’t need to spend time learning new programming languages to develop desktop apps if you’re already familiar with JS, HTML, and CSS. You can get straightaway into building the desktop app if you have adequate web development skills. On another note, Electron JS enables you to create cross-platform programs that run on Windows, Mac OS X, and Linux.
Electron combines Chromium and Node.js, a JavaScript runtime based on Chrome V8 JavaScript engine.
Before delving into Electron JS pentesting, it’s essential to understand the two types of processes that operate within an Electron application.
Main process
Renderer process
Each app can have only one Main process but multiple Renderer processes can be spawned by the main process. Main process is a privileged process because it runs in the Node.js environment and therefore it has access to Node.js APIs. Renderer, on the other hand, is the not-so privileged process, as the name suggests, it handles the rendering part.
Reversing Electron Applications
In Electron application penetration testing, reversing is the process through which you get to lay hands on the electron source code. Which is paramount as it allows you to examine the electron source code and identify the application security flaws. In this part, let’s get straight into processes required in reversing Electron apps.
Reversing .exe files
In the Windows platform, reversing the electron application is quite simple. Please follow the steps outlined below.
- You can download the Notable app from the following link.
- Install the downloaded application.
- Right-click on the application > Open file location.
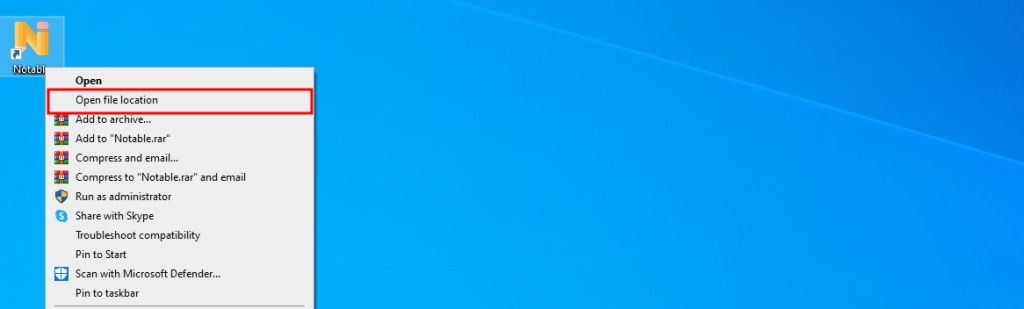
You may locate the application installed directory using the steps indicated above. There might be a chance to find something interesting and sensitive in this directory.
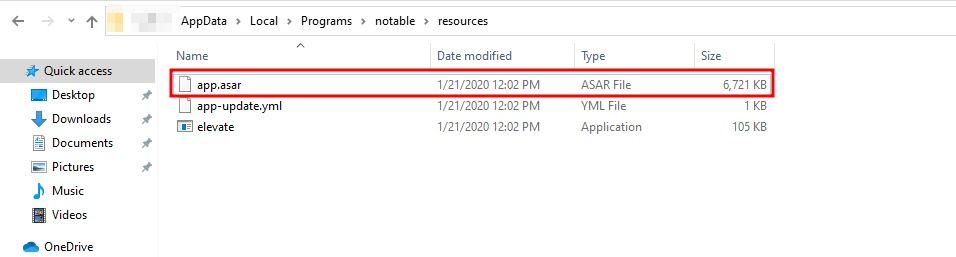
- Navigate the “resources” directory.
You can now see the app.asar file, which will be utilized for further examination and analysis.
Reversing .asar
For those who are not so familiar with asar files, an asar file is an archive that contains the source code for electron applications. Let’s try to reverse the .asar file that we obtained in the previous step.
Note:
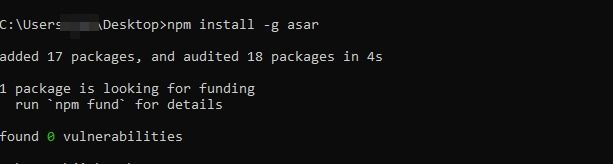
To continue, you’ll need to install node js and npm. The installation instructions can be found at the following URL: https://nodejs.org/en/download/.- Install asar.
- npm install -g asar
- Extract app.asar file.
asar extract app.asar dest-folder
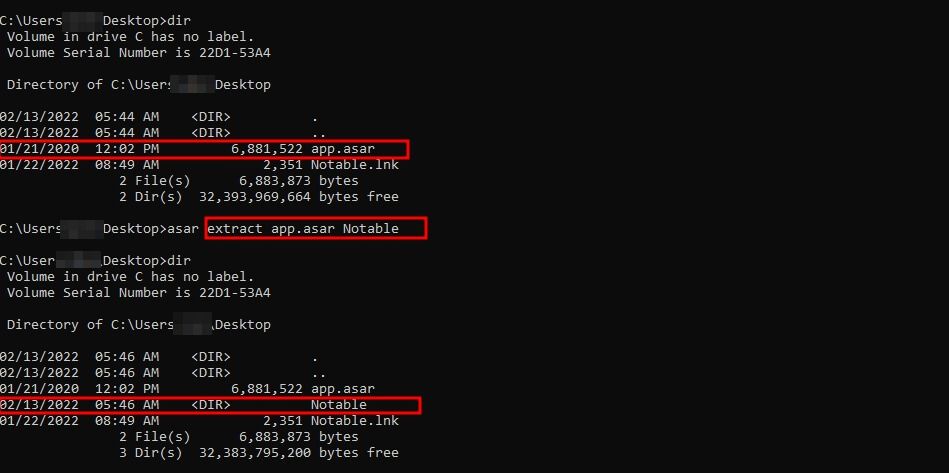
.asar package has been extracted, now we can examine the source code.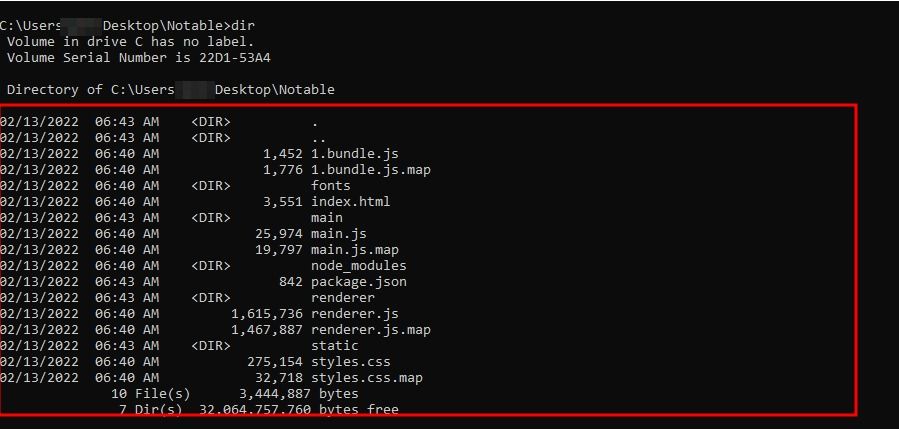
Identifying dependencies’ vulnerabilities
Third-party or open-source code is turning out to be inevitable for most of the applications that we deal with on a daily basis. If any dependencies utilized in applications are insecure, the programmed is likewise vulnerable. Which would definitely lead to undesired results.
The npm audit command comes handy here. It will assist you in identifying known vulnerabilities in your project’s dependencies. Let’s now take a look at how to execute the npm audit command below.
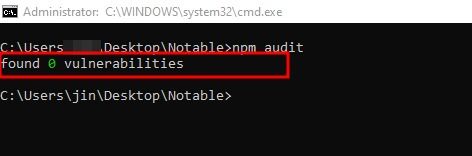
- To scan the Notable app, use the command following inside the extracted directory.
npm audit
In case you encounter any errors while executing the aforementioned command, you can use the following command to address the issue.
npm i –package-lock-only
- Run the npm audit command again.
npm audit
Hacking Electron Apps with Electronegativity
As per the official GitHub Repository, Electronegativity is a tool to identify misconfigurations and security anti-patterns in Electron-based applications.
Software developers and security auditors can use this tool to detect and mitigate potential weaknesses and implementation bugs when developing applications using Electron. A good understanding of Electron (in)security is still required when using Electronegativity, as some of the potential issues detected by the tool require manual investigation.
Tool Repository: https://github.com/doyensec/electronegativity
Installation
npm install @doyensec/electronegativity -g
Using Electronegativity
a. Navigate to the Electron Application’s Installation Directory which contains the asar file.
b. Open the terminal and run the following command:
CMD: electronegativity.cmd -i /file_path
Ex: electronegativity.cmd -i .
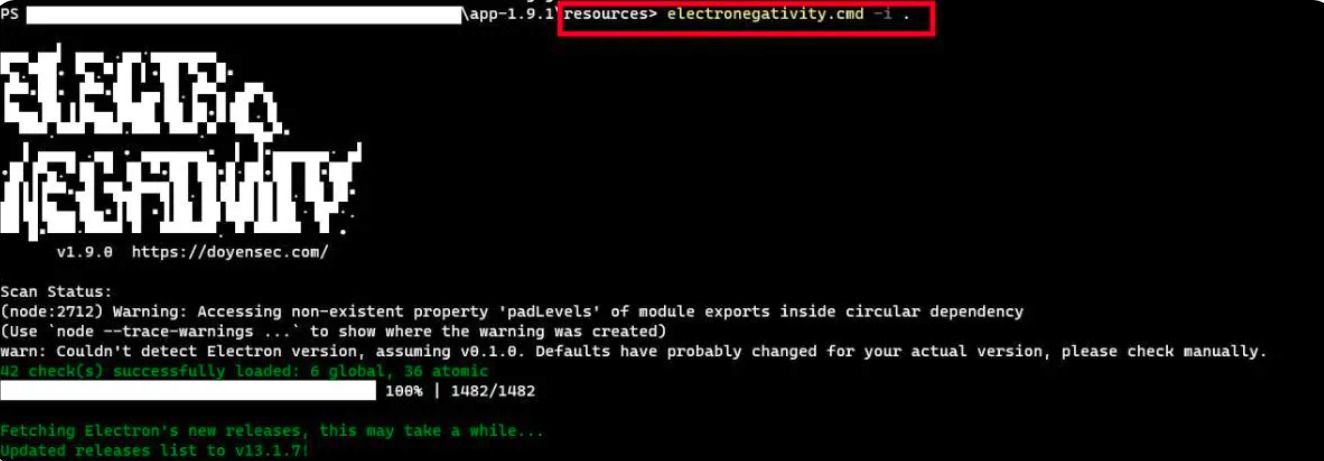
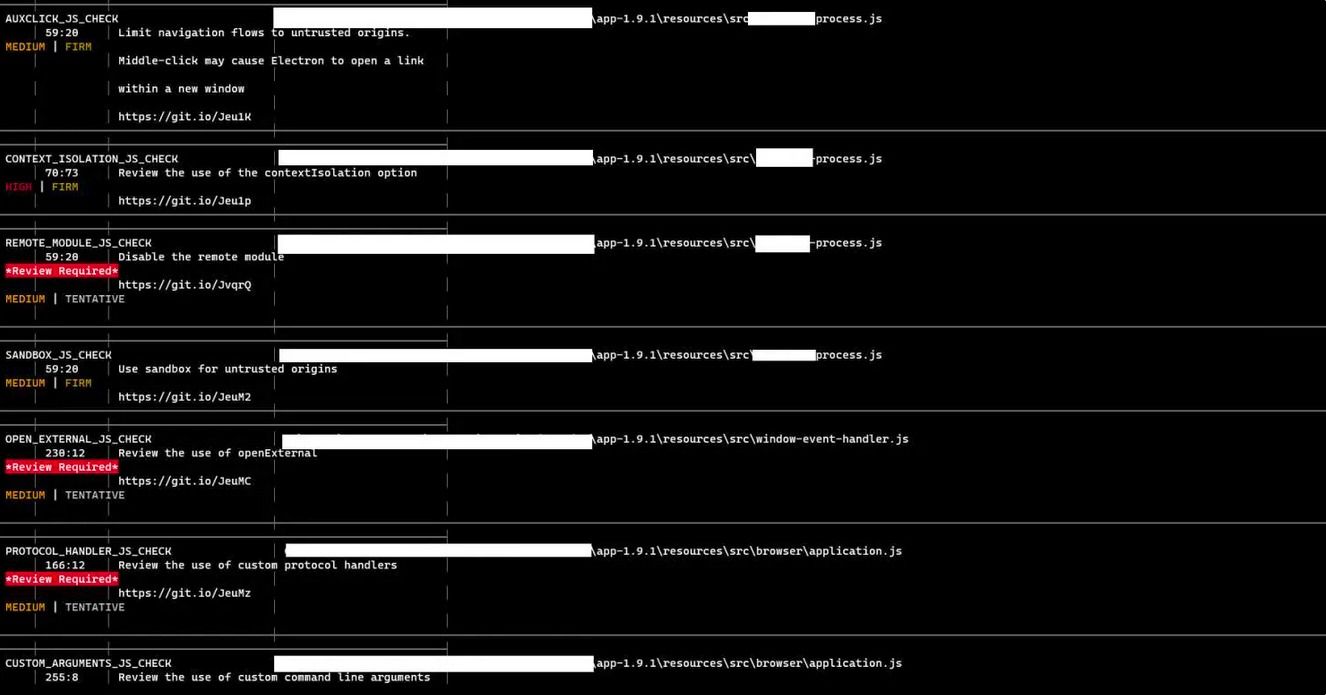
c. Observe that the tool returned with the misconfiguration and vulnerabilities.
Up to this point, you’ve obtained the source code of your application and have identified several dependency issues using tools like npm audit and Electronegativity.
Now, let’s look at the source code and identify the security flow.
Misconfigurations
The first step towards finding a vulnerability(after extracting the .asar file) is to find a place to search for, basically finding an entry point is your next task. Mostly, you will find package.json which acts like a configuration file for the application. Below is a snippet of package.json to give you an about what kind of information it contains:
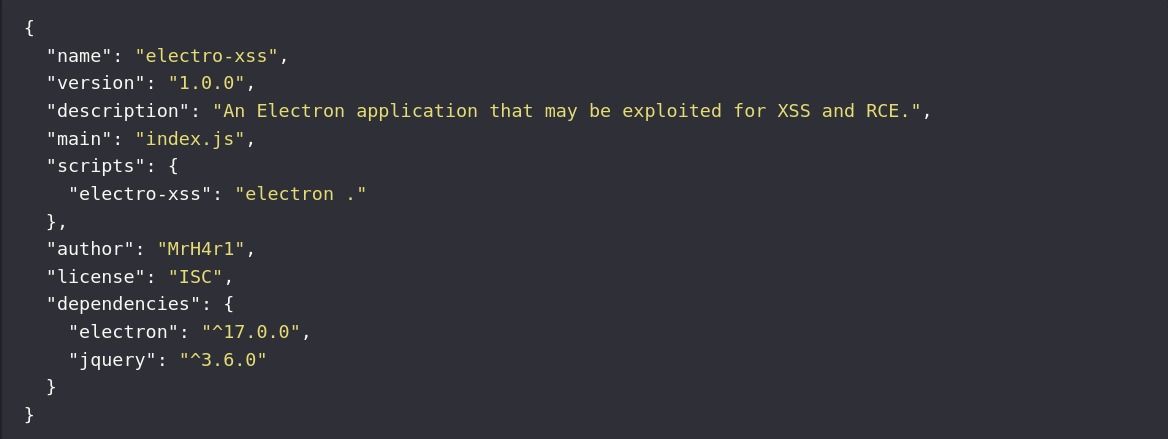
The main field in above snippet, points to the start-up script of the application(which is index.js in this case), this index.js is our entry point in this scenario. After getting to the entry point, you can now look out for certain misconfigurations that carry huge impact. Electron is provided with two significant features, that are commonly exploited:
- node Integration : allows application to access Node.js APIs to work with system components
- context Isolation : separates/isolates Electron’s internal logic and preload script from the actual application code
Node Integration
This basically allows the renderer process to use Node.js APIs to use the wide range of system functionalities it offers, like arbitrary file read/write, creating child processes, execution of binary files, performing network related operations. Enabling this will give the client side scripts access to system wide functionalities.
Vulnerable code will look something like this:
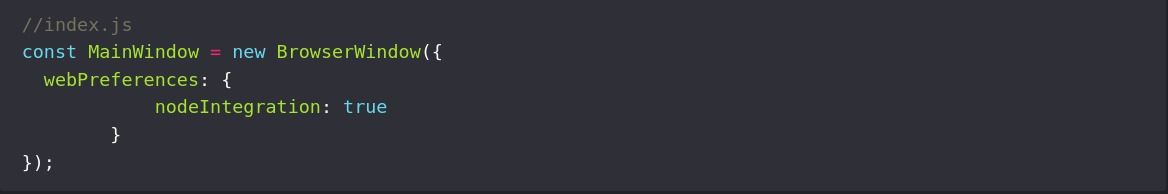
Browser Window is an object that is used to control window functions such as minimization, maximization, window creation, etc.
Let’s consider a scenario where the application takes the user input directly and appends to the elements without having any validation. Hence we can execute arbitrary JavaScript (XSS) via a crafted message. Because it is vulnerable to XSS, the attacker can now inject arbitrary JS code with require() function.
<img src=x onerror=alert(require(‘child_process’).exec(‘xcalc’))> //a simple payload to pop a calculator.
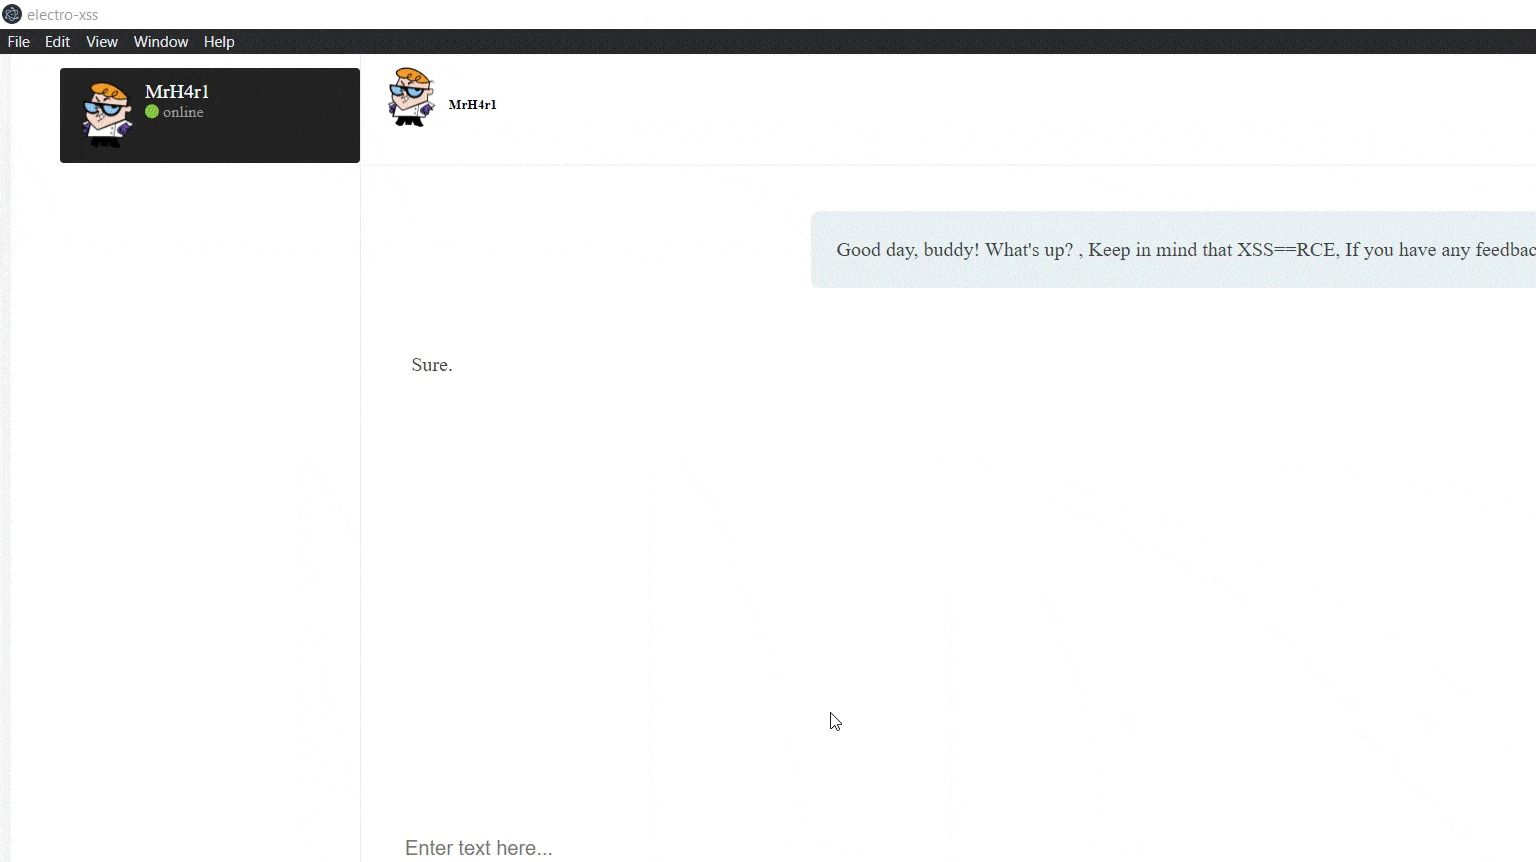
BOOOOOM!!!! From XSS to RCE: We’ve upgraded our bugs from “sprinkles on the cupcake” to “icing on the cake”!
Enabling the developer tools in the renderer process
During testing, it is particularly important to review all web resources as we would normally do in a standard web application assessment. For this reason, it is highly recommended to enable the Developer Tools in all renderers and <WebView> tags.
Electron’s Main process can use the Browser Window API to call the Browser Window method and instantiate a new renderer.
In the example below, we are creating a new Browser Window instance with specific attributes. Additionally, we can insert a new statement to launch the Developer tools:
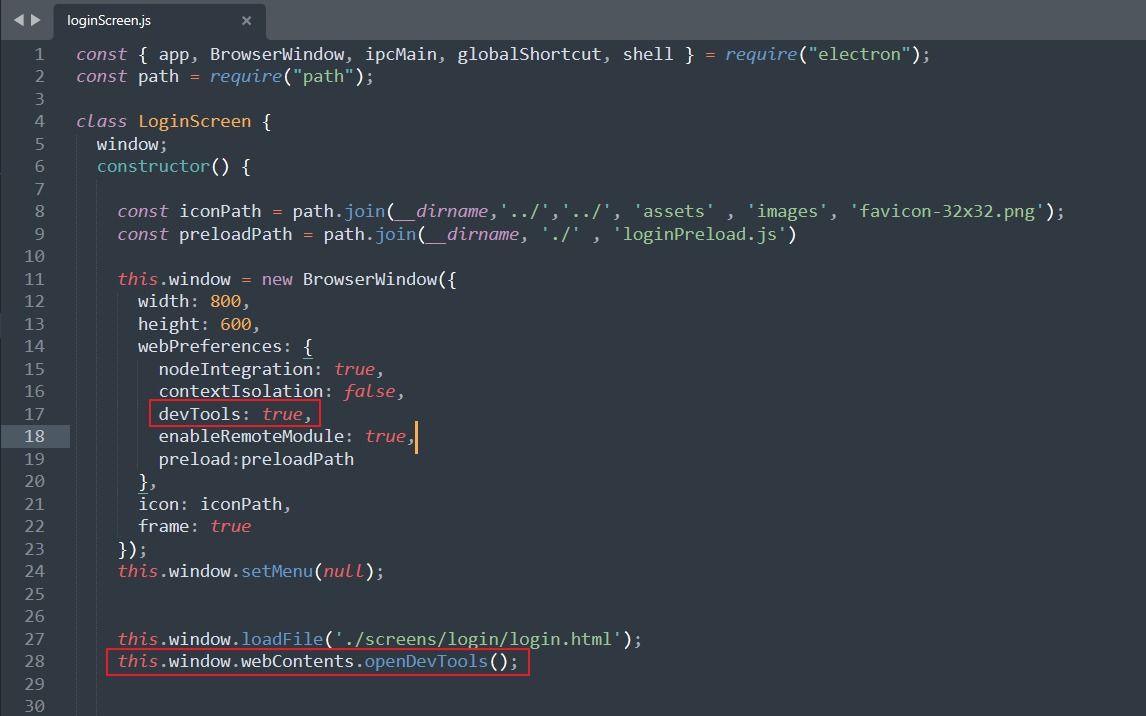
Let’s consider a scenario where app decides to keep usernames and passwords in local storage, which is like a digital cookie jar. But uh-oh, if someone turns on the developer tools, it’s like leaving the cookie jar wide open for anyone to grab the goodies inside. Not exactly the best security move, right?
Debugging the Main Process
Since it is not possible to open the developer tools for the Main Process, debugging this component is a bit trickier. Luckily, Chromium’s Developer Tools can be used to debug Electron’s main process with just a minor adjustment.
The Dev Tools in an Electron browser window can only debug JavaScript executed in that window (i.e. the web page). To debug JavaScript executed in the main process you will need to leverage the native debugger and launch Electron with the –inspect or –inspect-brk switch.
Use one of the following command line switches to enable debugging of the main process:
–inspect=[port]
Electron will listen for V8 inspector protocol messages on the specified port, an external debugger will need to connect on this port. The default port is 5858.
–inspect-brk=[port]
Like –inspect but pauses execution on the first line of JavaScript.
Usage: electron –inspect=5858 your-app
You can now connect Chrome by visiting chrome://inspect and analyze the launched Electron app present there.
So, By manipulating the victim’s package.json to open a remote debugging port, attackers configure Chromium’s devtools to connect to the victim’s IP and debugger port. This allows them to execute commands on the victim’s Windows system, posing a serious security threat.

Divy Kansara, Certbar Security’s penetration tester, excels in Web R&D with 2 year’s expertise, focusing on Network and Web VAPT. VTU B.Tech graduate.
Share