A Deep Dive into Modules of DFIR-IRIS.
- In this extended guide, we’ll break down DFIR IRIS into more granular details. The aim is to give you a comprehensive understanding of how this tool operates across all its modules and processes, focusing on how tickets are generated and managed. This is especially useful for cybersecurity professionals who want to maximize the capabilities of IRIS for incident response and digital forensics. We’ll go over every feature, its purpose, and some pro tips to ensure you’re using the platform effectively.
What is DFIR IRIS?
- DFIR IRIS is an open-source Digital Forensics and Incident Response platform designed to facilitate the management of complex cybersecurity incidents. It integrates with various tools and workflows, helping teams respond to threats in a streamlined and organized manner. Whether you’re dealing with internal breaches, external attacks, or complex threat investigations, DFIR IRIS acts as the hub for case management, task delegation, and alert analysis.
- For more detail on what DFIR-IRIS is and how to install it you can read my previous blog.
Link: https://certbar.com/technical-blogs/install-dfir-iris-and-integration-with-wazuh
Expanded Breakdown of DFIR IRIS Modules
1. Dashboard: Central Control at a Glance
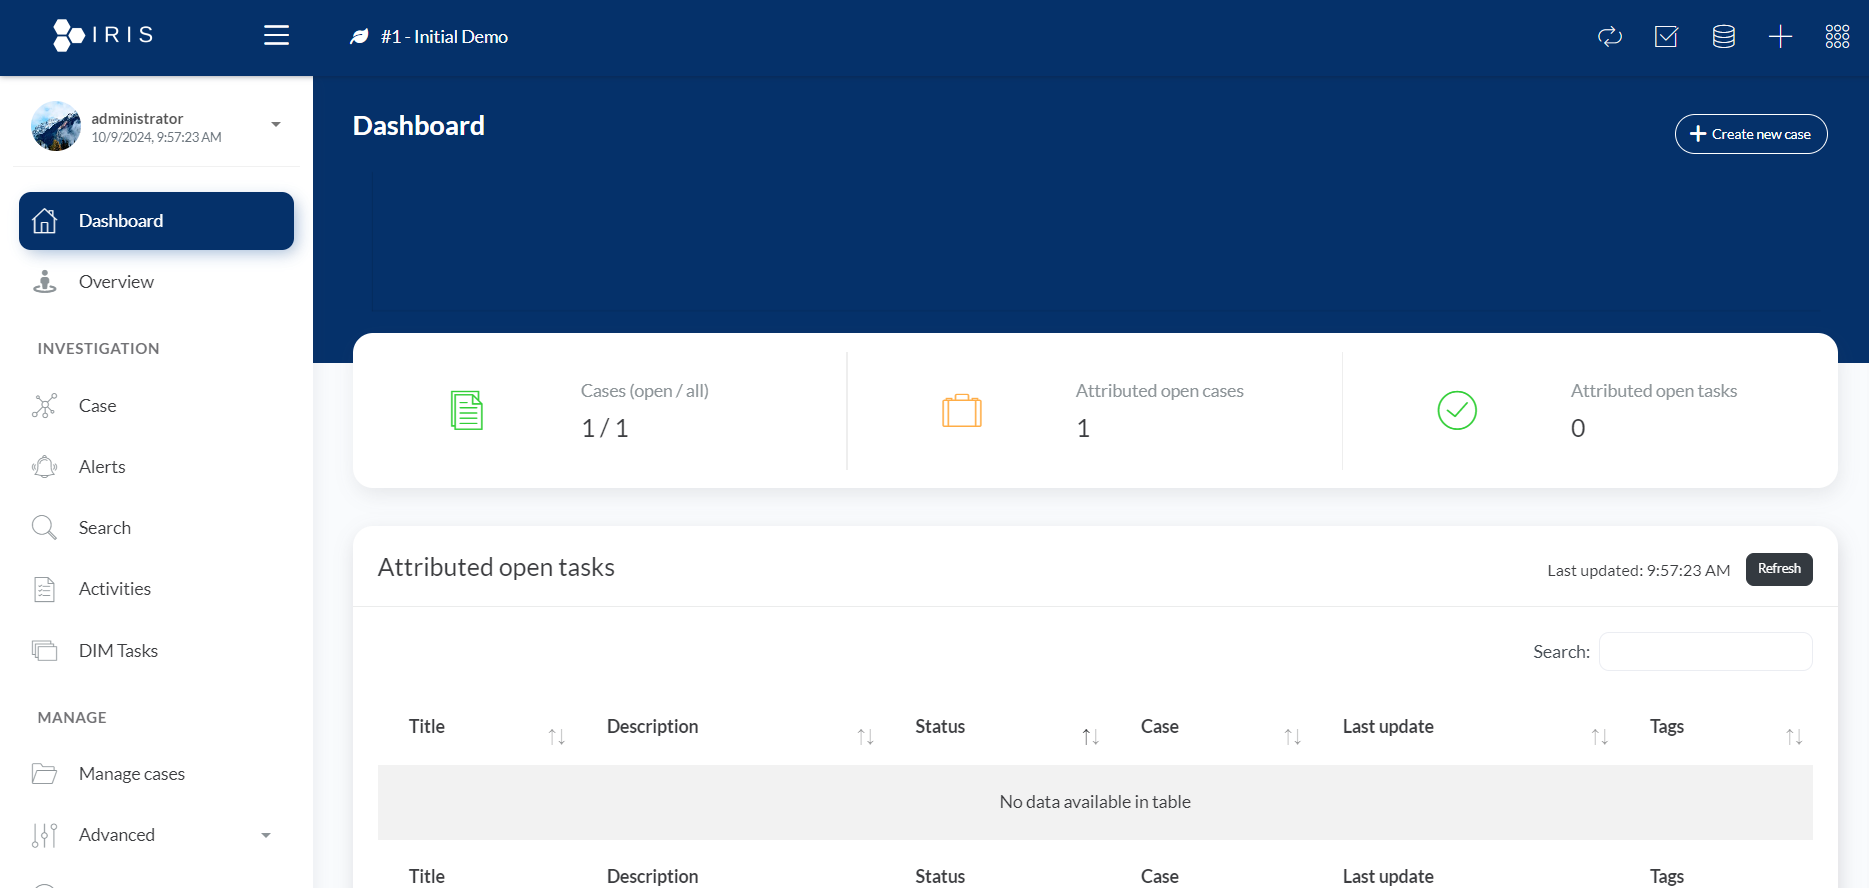
- The Dashboard provides an overview of the current situation within the IRIS environment. It’s designed to give users a snapshot of important metrics like active cases, pending tasks, recent alerts, and system performance. This section is highly customizable, so you can prioritize the information most important to your organization.
- Key Features:
- Active Cases Summary: See the status of cases that are open, closed, or in progress.
- Task Overview: Monitor DIM tasks that are assigned or pending.
- Recent Alerts: Get a quick look at critical alerts and threats flagged by the system.
- Custom Widgets: Configure widgets to display data that matters most to you.
2. Overview: Incident Trends & System Health
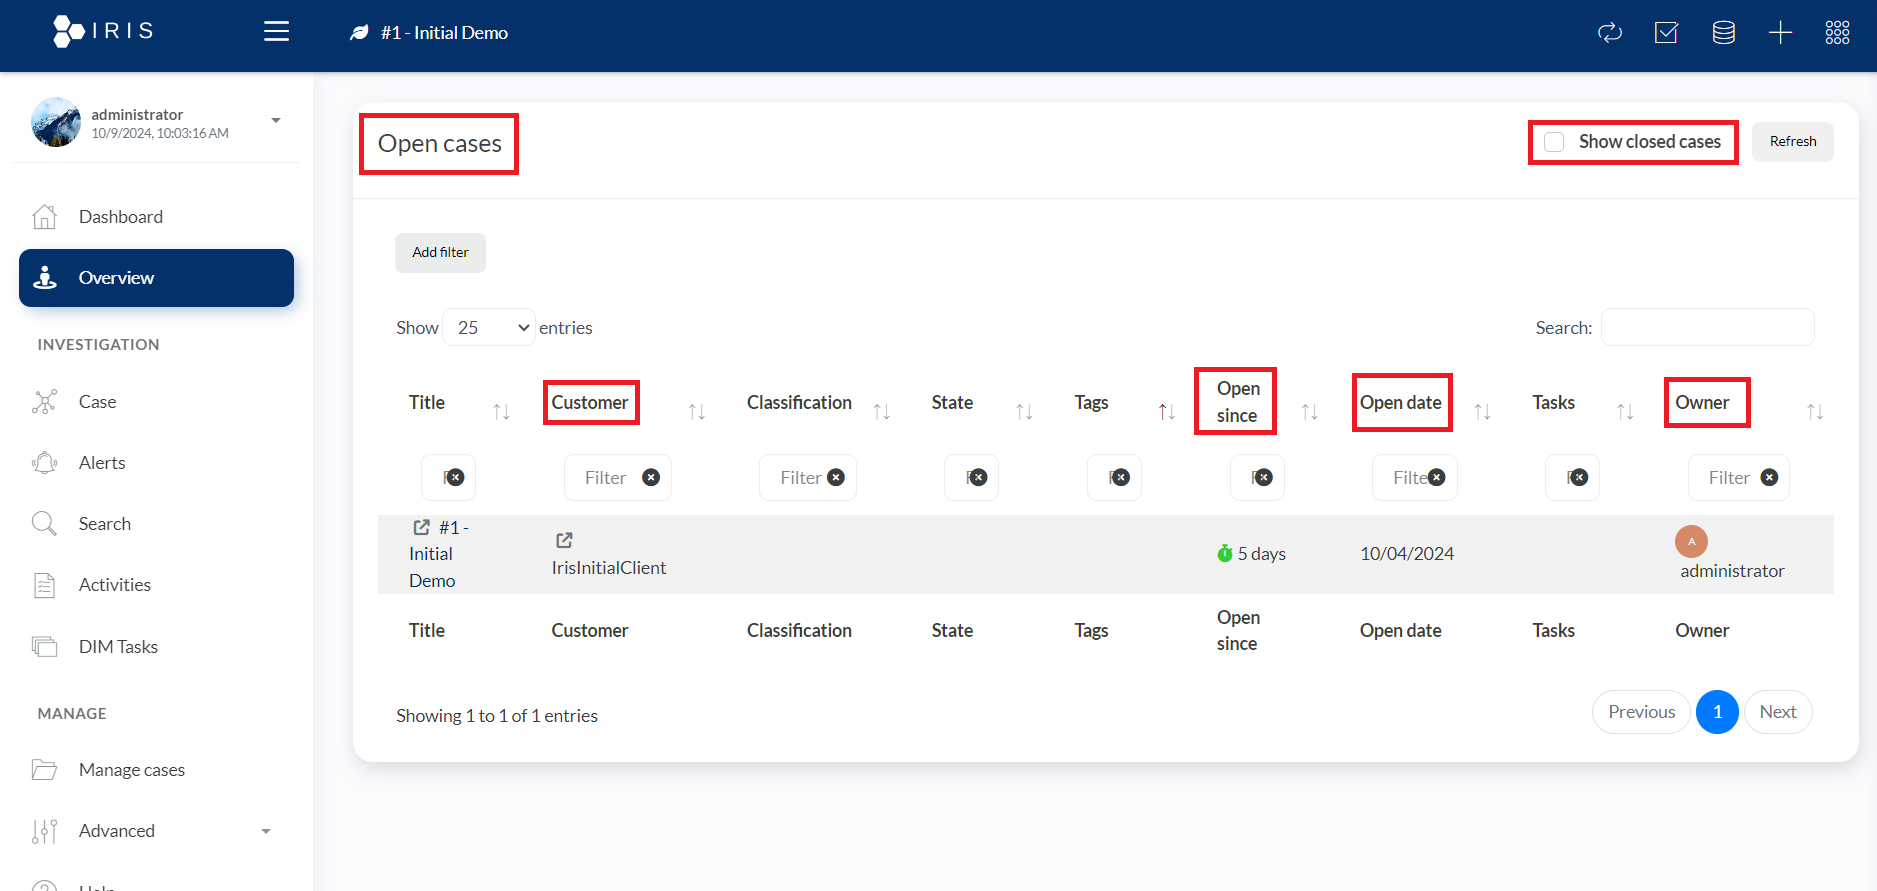
- The Overview section is essential for tracking broader trends within the system. It aggregates information from various modules and displays it in a digestible format, allowing you to observe how threats evolve over time.
- What You Can Monitor:
- Incident Frequency: Analyze how often certain types of incidents are occurring.
- Open Since - Open date: See from how many days a particular case is open and on which date the case was open.
3. Case Management: Handling the Investigation Lifecycle
- The Case Management module is arguably the heart of DFIR IRIS. It allows you to track every detail of an incident, from the initial detection to resolution. Within this module, you can assign team members, add evidence, and update the status of cases as investigations unfold.
The case section is divided into 8 parts which helps to understand and manage any case gracefully.
- More Details on Case Functionality and the 8 parts:
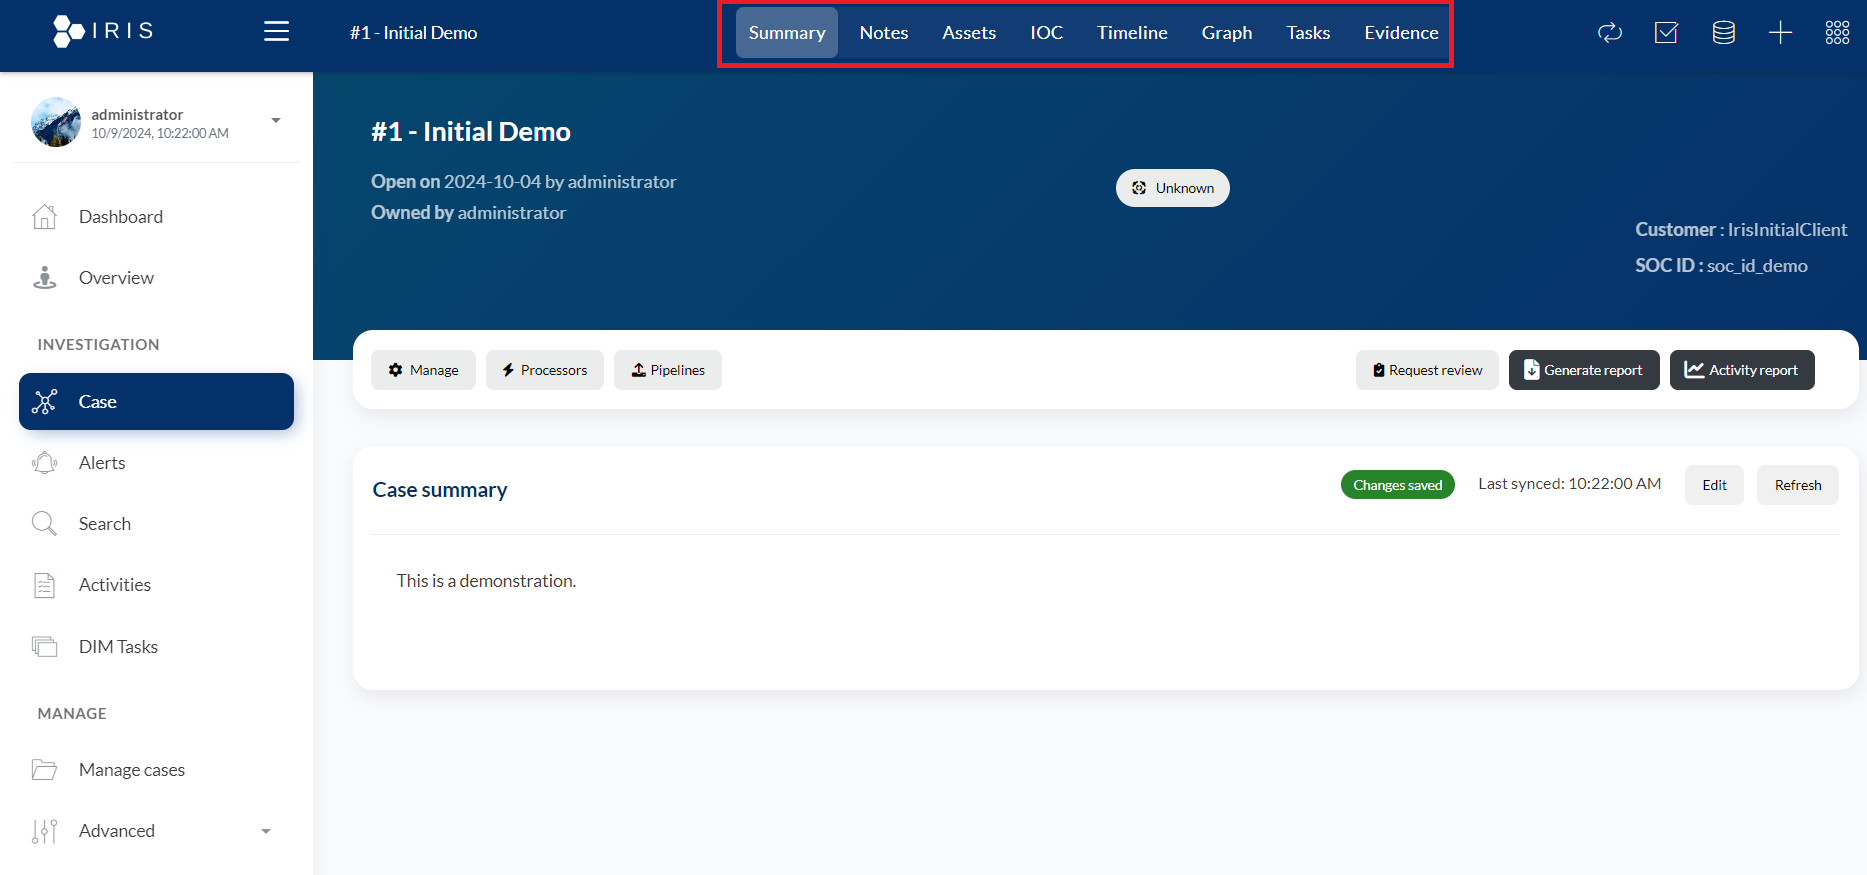
- Summary:
- Case Title and Ownership:
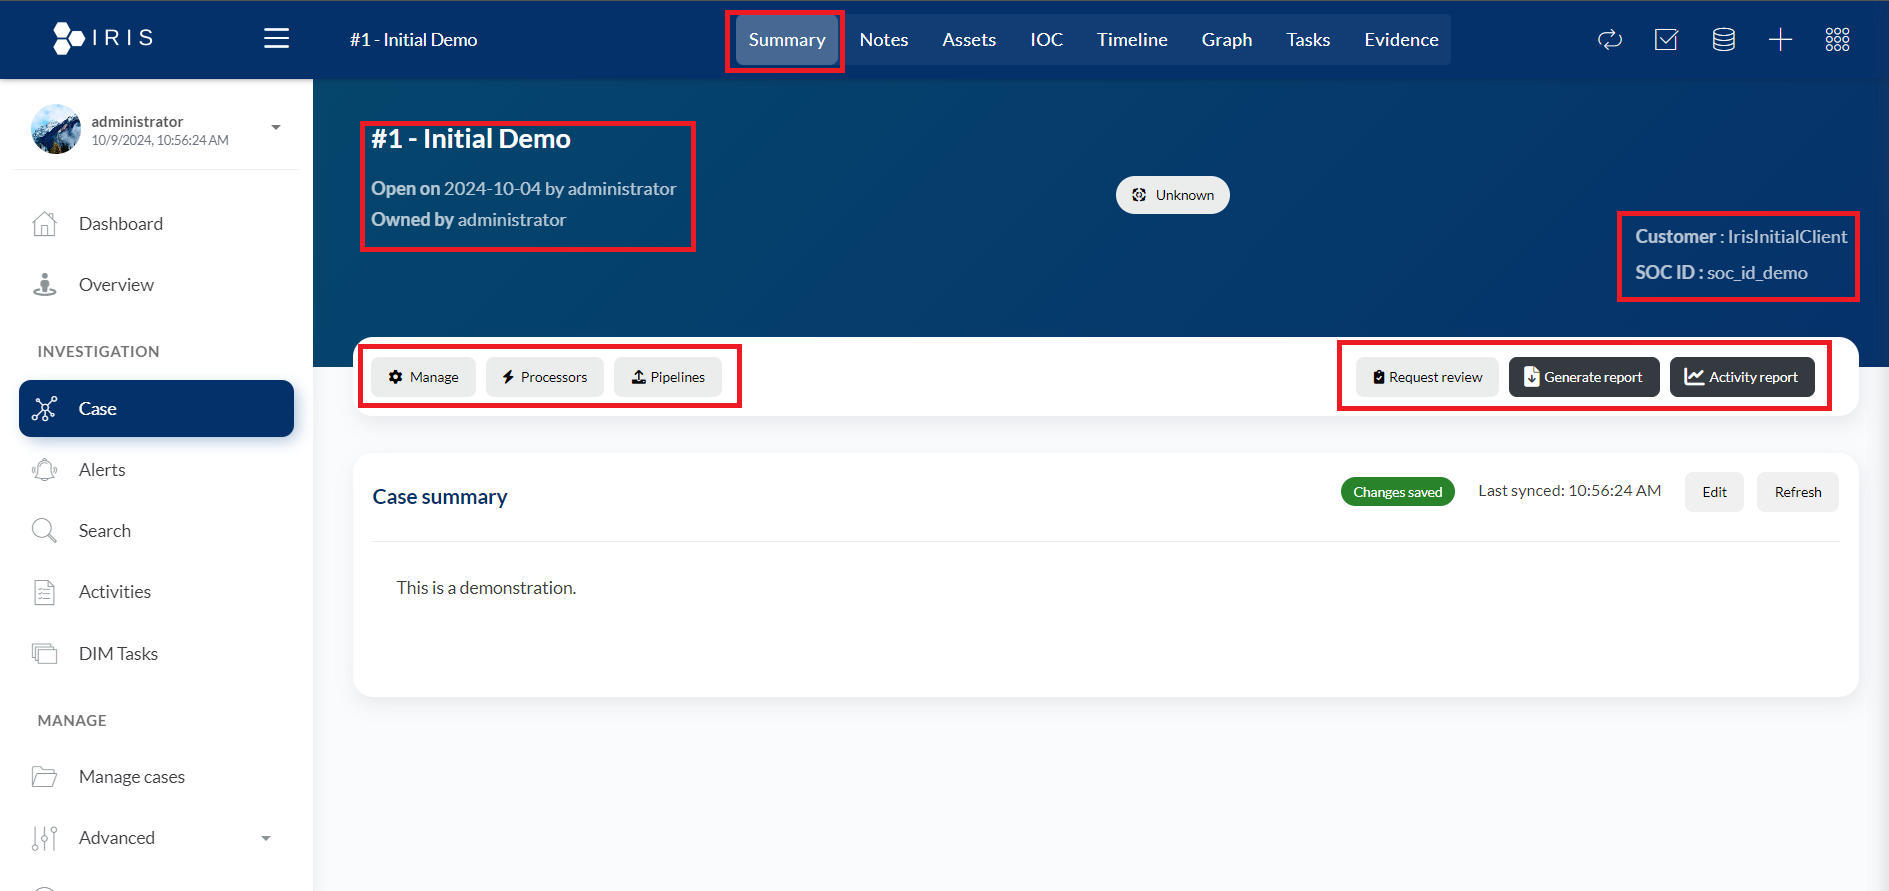
- #1 - Initial Demo: This refers to the case number and name of the case. In this example, it is the "Initial Demo" case.
- Open on 2024-10-04 by administrator: Shows the date and time when this case was opened and by whom. The administrator created this case on October 4, 2024.
- Owned by administrator: Indicates that the current owner or handler of this case is the user with the "administrator" role.
- Action Buttons (Manage, Processors, Pipelines):
- Manage: Clicking this would likely allow the user to manage the case, including updates, assignments, or additional settings related to the case.
- Processors: This could provide access to various automated processes or analysis engines (processors) that can be applied to the case data.
- Pipelines: Refers to a sequence of automated tasks or processes (pipelines) that may help in incident response, analysis, or reporting for the case.
- Customer and SOC ID:
- Customer: IrisInitialClient: This shows the client or customer associated with this specific case. In this instance, the case is tied to "IrisInitialClient."
- SOC ID: soc_id_demo: This is the identifier of the Security Operations Center (SOC) associated with this case. "soc_id_demo" is likely a placeholder for demonstration purposes.
- Request Review, Generate Report, and Activity Report Buttons:
- Request Review: This button might allow the user to request a review of the case, likely by peers, supervisors, or automated systems, to ensure the incident is being handled correctly.
- Generate Report: This feature likely allows the user to generate a detailed report summarizing the case, its findings, and actions taken during the investigation.
- Activity Report: Provides a detailed log or report of all activities associated with the case, including timeline events, actions taken by users, alerts, and processor activities.
- Notes: The Notes section is essential for maintaining a detailed record of actions taken, evidence found, and insights gained during the investigation. It helps teams collaborate effectively by sharing insights and maintaining proper documentation within the platform.
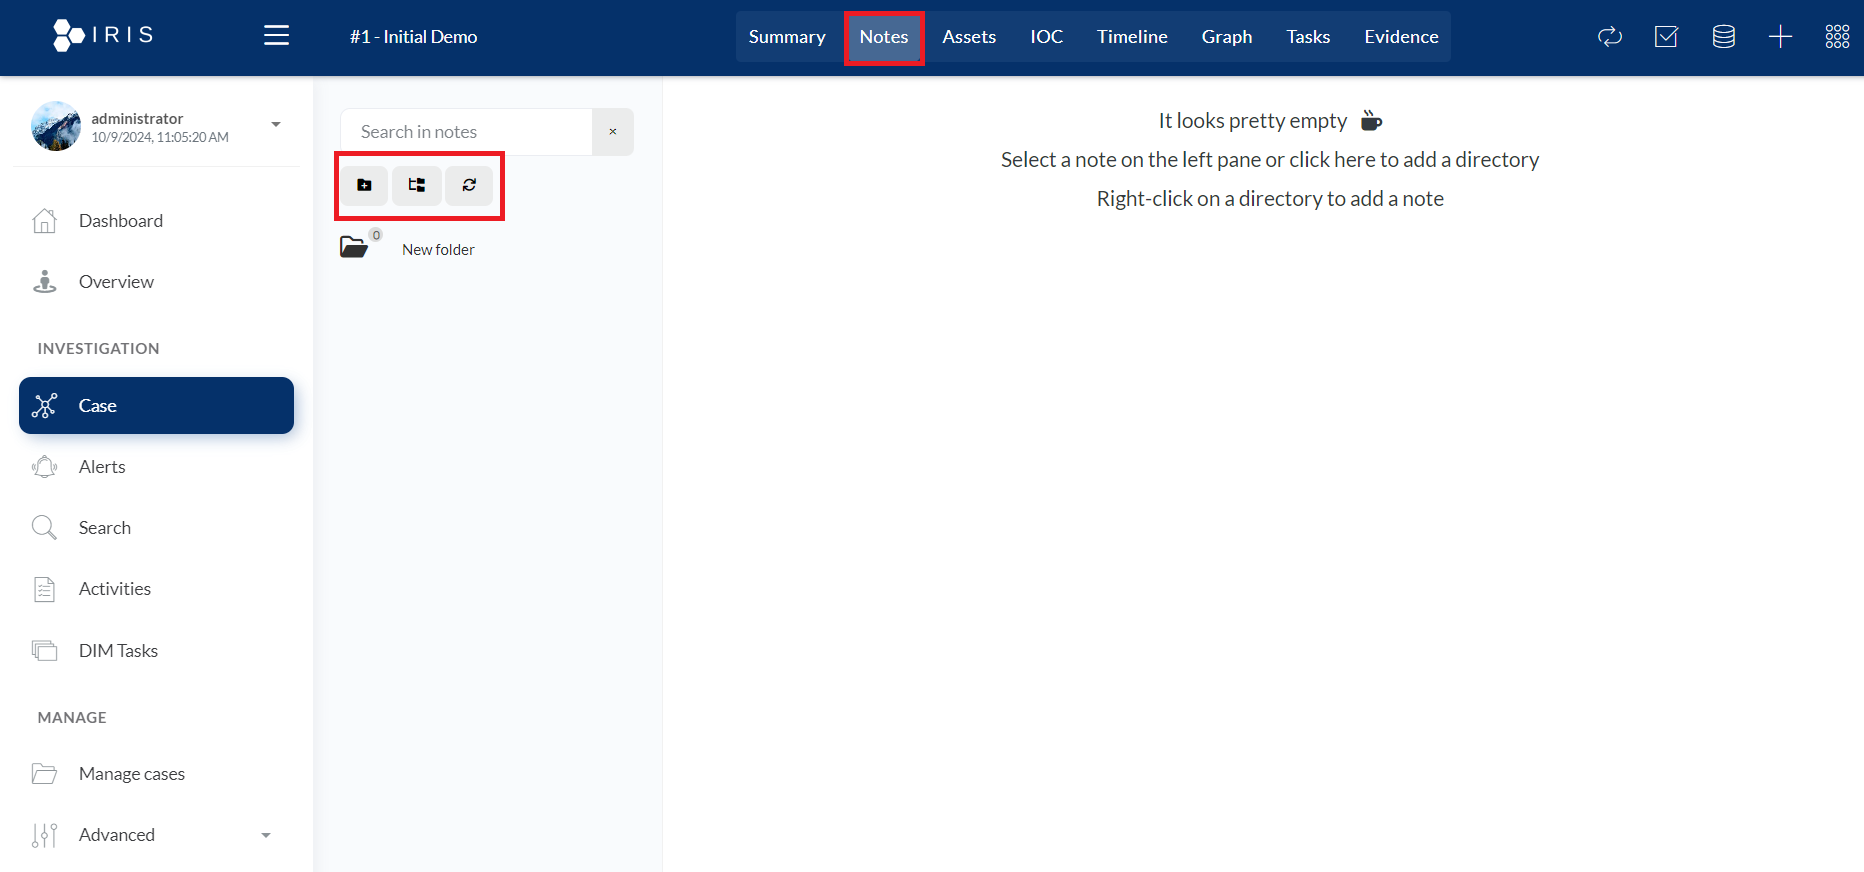
- Add Folder Icon: This icon allows users to create a new folder to organize notes. This could help in categorizing different types of information within a case (e.g., evidence notes, investigative steps, etc.).
- Fold/Unfold Directories Icon: The option to fold or unfold directories provides a way to organize and view a list of notes more effectively. Users can collapse folders to hide their contents, making the interface cleaner when many notes or categories are present, or expand them to view all items within the folder.
- Refresh Icon: The refresh icon is generally used to reload or update the notes section, ensuring that any changes or additions are reflected immediately.
- New Folder Icon: there's an option for creating or displaying folders. "New folder" suggests that the user can organize notes into folders, making it easier to manage and sort through information.
- ASSETS: The Assets section allows security analysts to manage and track assets involved in an investigation. Here's a breakdown of the section.
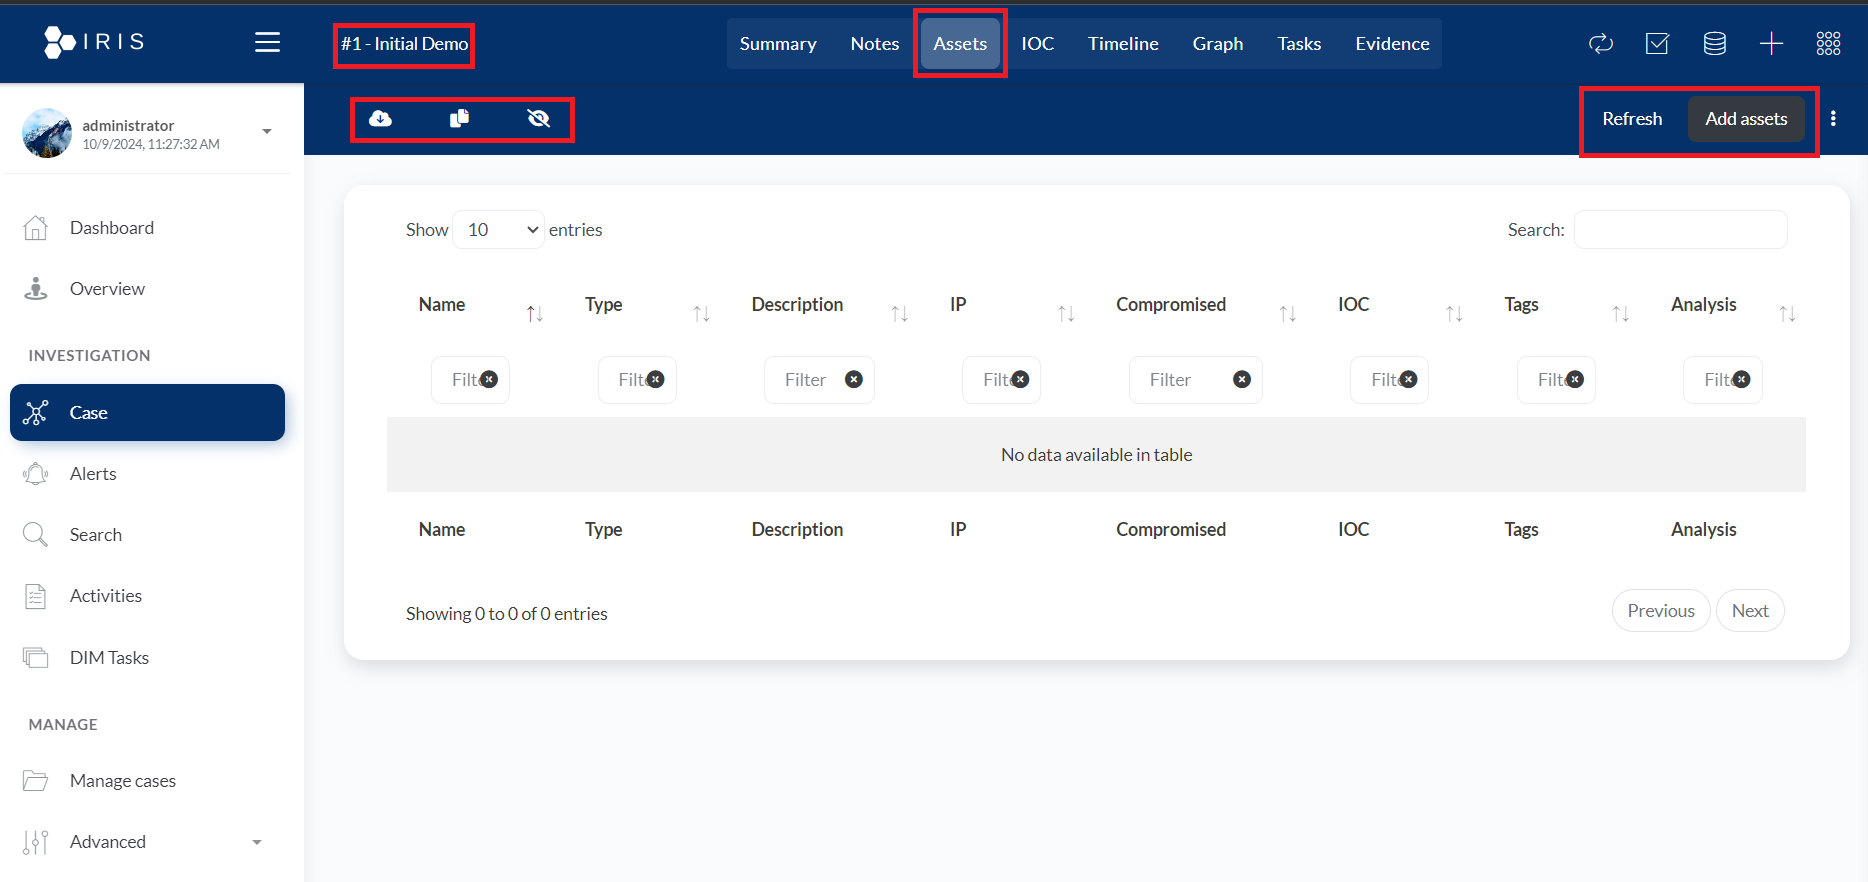
- Download icon: Likely used to import or upload asset-related data (e.g., CSVs, log files).
- Copy icon: Possibly allows the duplication of asset data or export of details for external analysis or reports.
- Toggle Columns icon: This tool helps customize the visible columns in the asset list (e.g., Name, Type, IP, Compromised status) to enhance data viewing and organization.
- Refresh Button: Used to refresh the asset table to ensure it's displaying the most up-to-date information related to the assets involved in the investigation.
- Add Assets Button: This allows the analyst to add new assets to the case manually. This could include devices, IPs, or systems that are part of the investigation.
- IOC(Indicators of Compromise): This section is likely used to manage and track Indicators of Compromise, which are data artifacts that indicate a potential or confirmed security breach (e.g., malicious IP addresses, file hashes, or domain names).
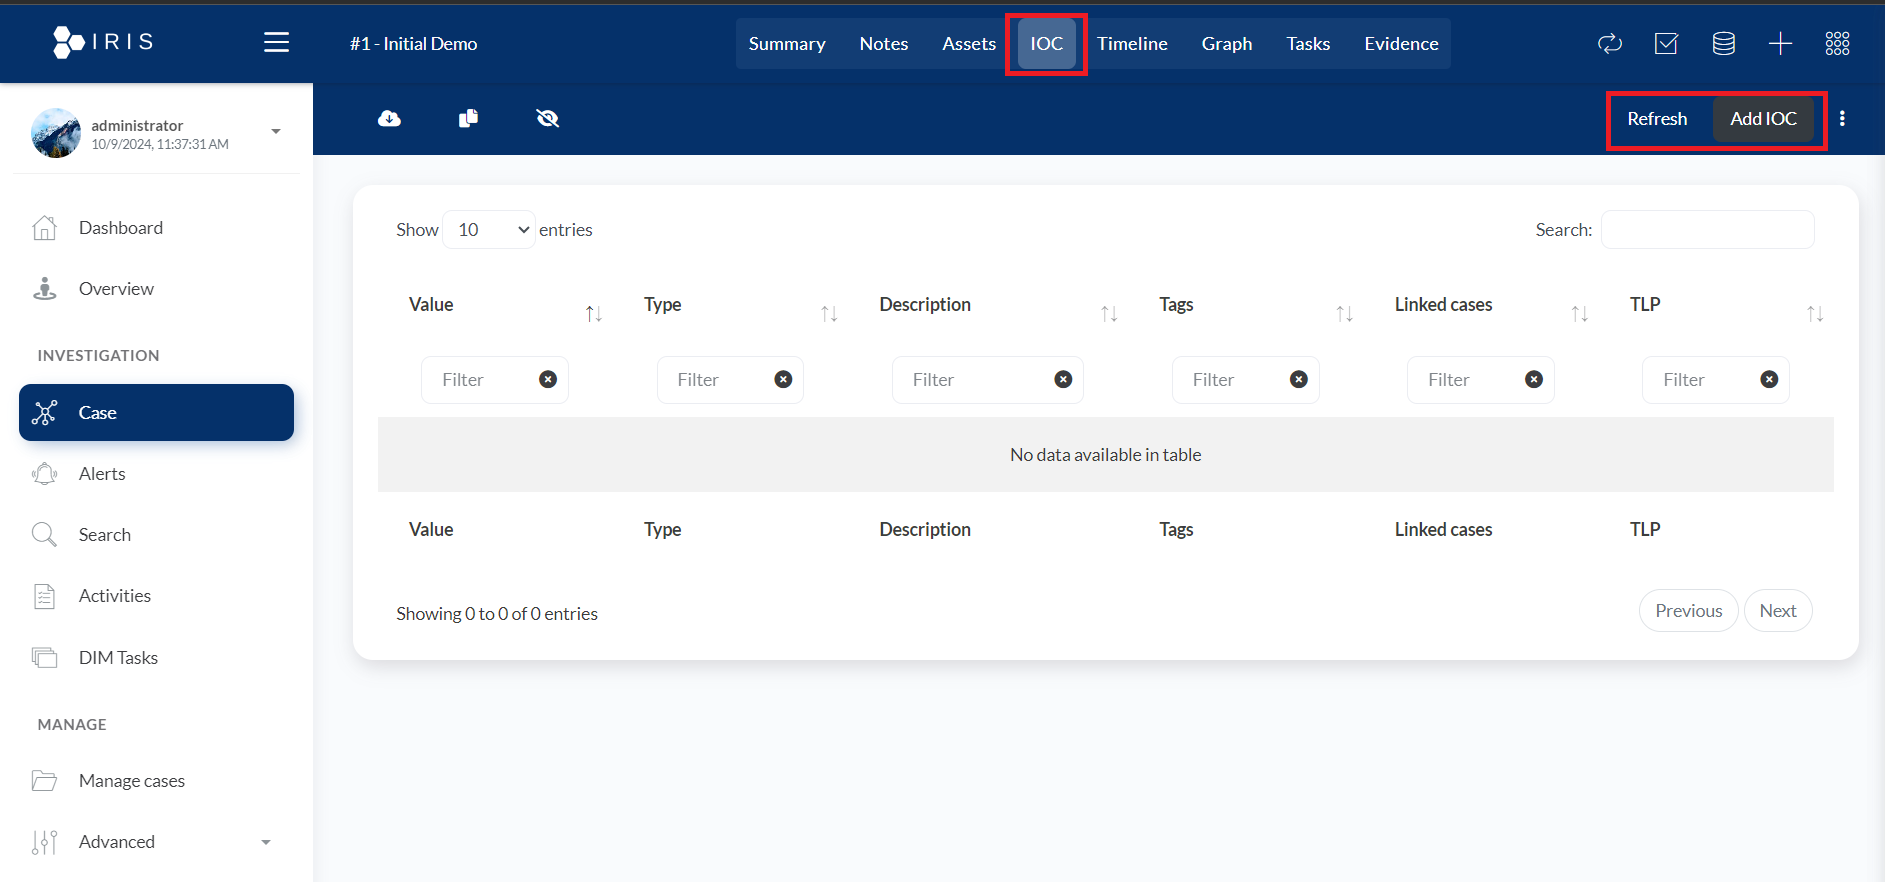
- Add IOC and Refresh Buttons (Right): The red box around "Add IOC" and "Refresh" buttons allows the user to add a new IOC to the table or refresh the list of IOCs to update any changes or new entries.
- IOC Table: The IOC table in the DFIR-IRIS platform is designed to organize and display Indicators of Compromise (IOCs) in an investigation. Here's a detailed breakdown of the table's columns and functionality:
- Value: This represents the specific IOC data, such as a malicious IP address, domain, file hash, or other indicators that have been identified as suspicious or harmful.
- Type: The category or classification of the IOC (e.g., IP address, domain, file hash, URL, etc.).
- Description: Provides additional context or details about the IOC, such as what kind of threat or attack it is related to.
- Tags: Custom or predefined tags that help categorize or group IOCs for easier identification and management.
- Linked Cases: This indicates which investigations or cases the IOC is associated with, helping to track its relevance across multiple incidents.
- TLP (Traffic Light Protocol): This refers to the sharing protocol used to label the sensitivity of the IOC data, which controls who can access and share this information.
- Timeline: The Timeline helps investigators organize and view the chronological order of events related to an incident. It's useful for tracking key activities, changes, or findings over time, giving investigators a clear understanding of when and how certain events occurred in a case.
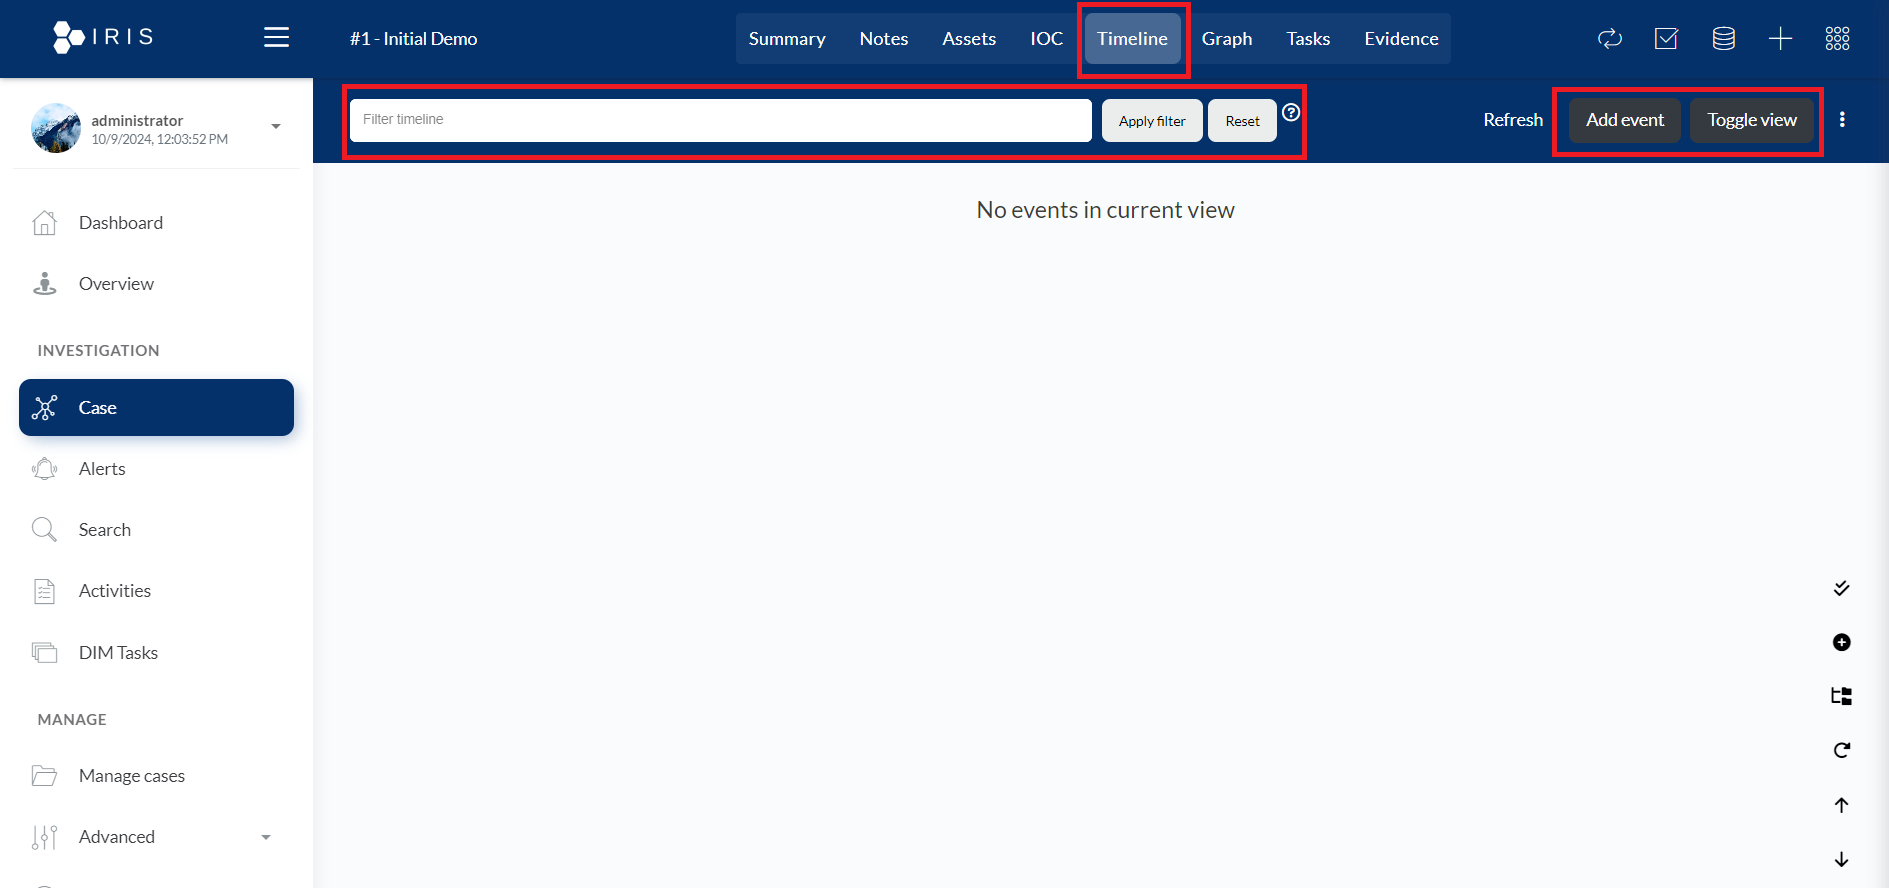
- Filter Timeline: This section allows users to filter the timeline by entering keywords or specific terms in the search box. After typing in the filter criteria, the user can press "Apply filter" to filter the events on the timeline or "Reset" to clear the filter and view all events.
- Add Event: This button allows the user to manually add a new event to the timeline. For instance, an investigator could add important timestamps, logs, or findings to track specific details of the investigation.
- Toggle View: This option allows the user to switch between different views of the timeline, potentially changing the layout or detail level of the events displayed.
- Graph: The Graph section in DFIR-IRIS is a visualization tool that helps investigators understand relationships and connections between various elements of a case, such as IOCs, assets, events, or users.
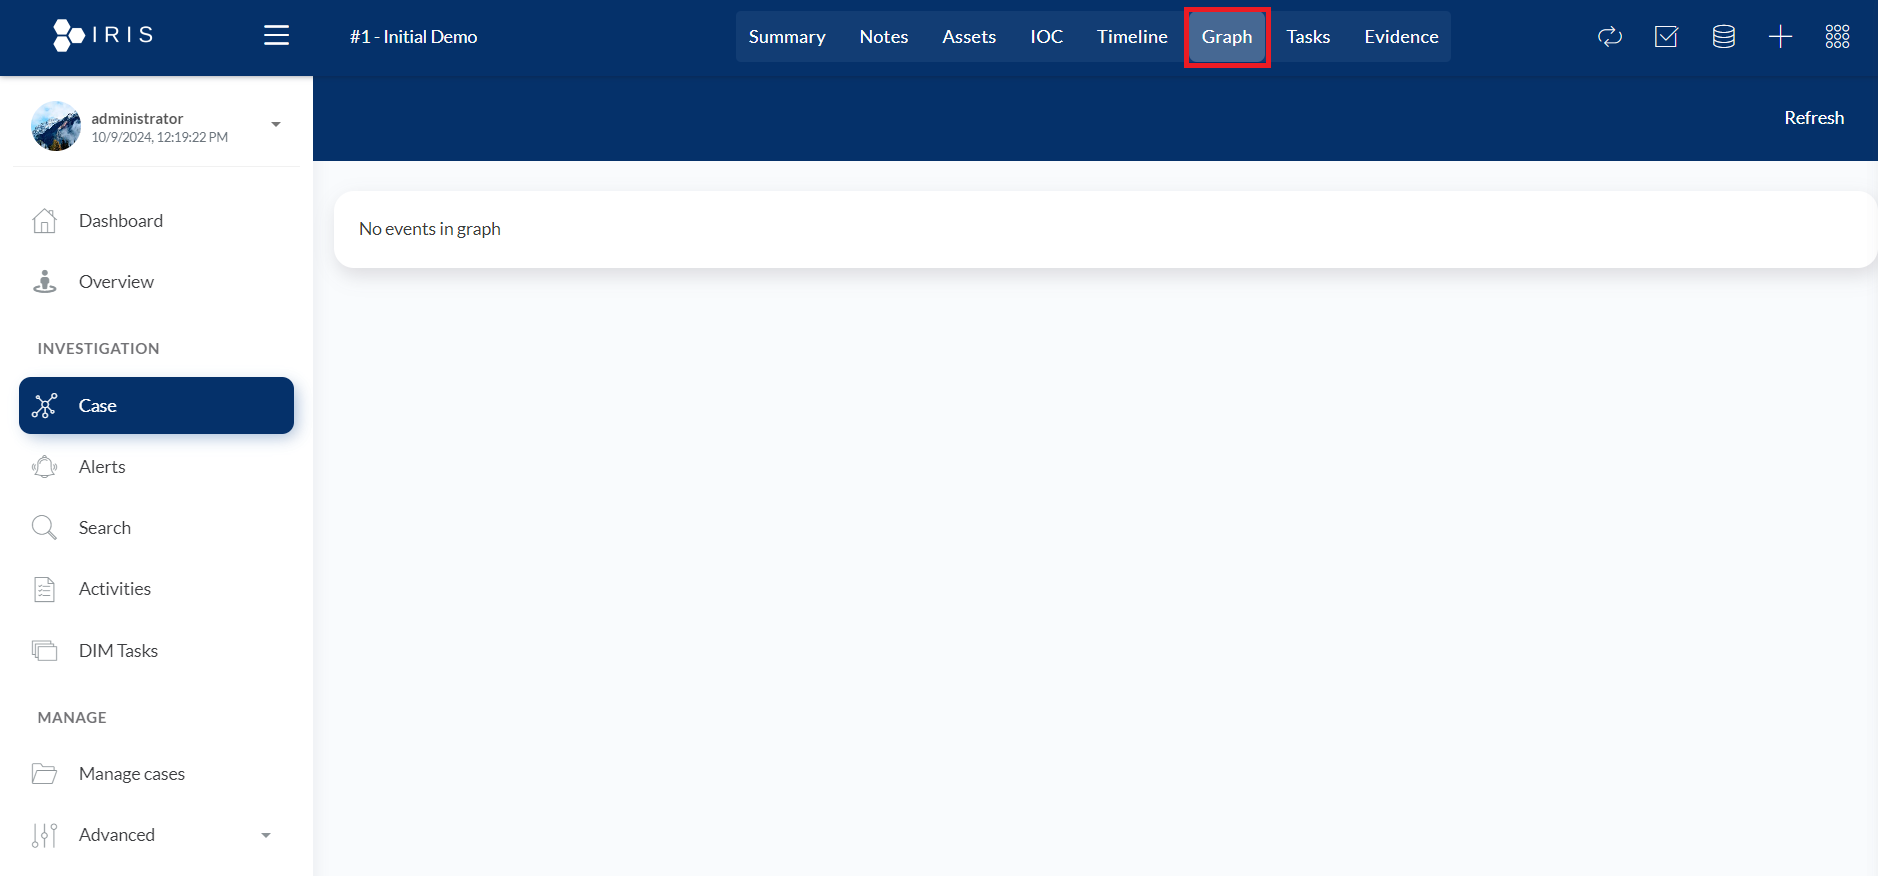
- This section is crucial for investigations involving multiple entities and can greatly enhance the understanding of how various components of an incident are related.
- Tasks: This section is used to manage the tasks associated with a particular case or investigation. It's accessible from the main navigation at the top and is likely where tasks related to an investigation are created, viewed, and managed.
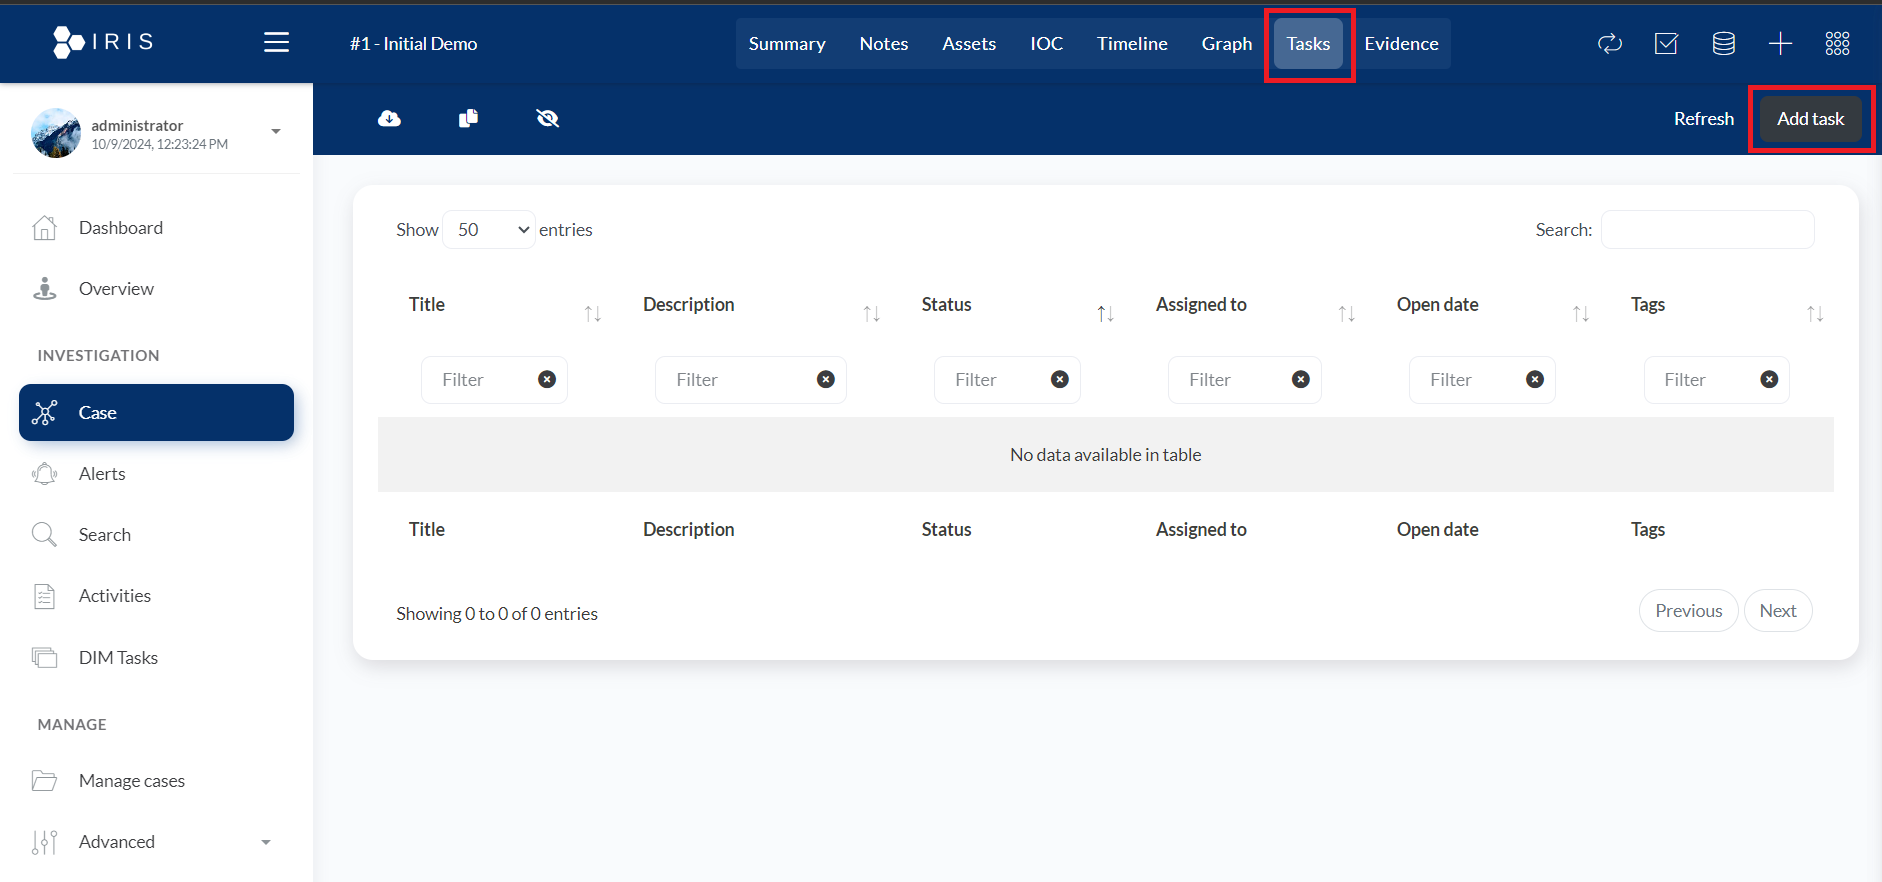
- Add Task button: This button allows the user to create and assign a new task to team members or investigators. When clicked, it would typically open a form or modal where task details such as title, description, due date, and assignee can be specified.
- Tasks Table: The Tasks Table in the DFIR-IRIS interface is designed to display a list of tasks associated with a particular investigation or case. Here's a breakdown of the elements in the table:
- Title: The name or brief description of the task. This column likely shows the main task identifier for quick reference.
- Description: A more detailed explanation of the task, outlining the specifics of what needs to be done.
- Status: The current state of the task (e.g., Open, In Progress, Completed). This column helps track the progress of each task.
- Assigned to: The individual or team responsible for completing the task. This column helps monitor task ownership.
- Open date: The date when the task was created or assigned, useful for tracking timelines.
- Tags: Custom labels or tags that help categorize or organize tasks for better filtering and searching.
- Evidence: This section allows users to manage and register evidence related to an investigation. The tab is part of the main navigation bar at the top, and when selected, it displays a list of registered pieces of evidence for the case.
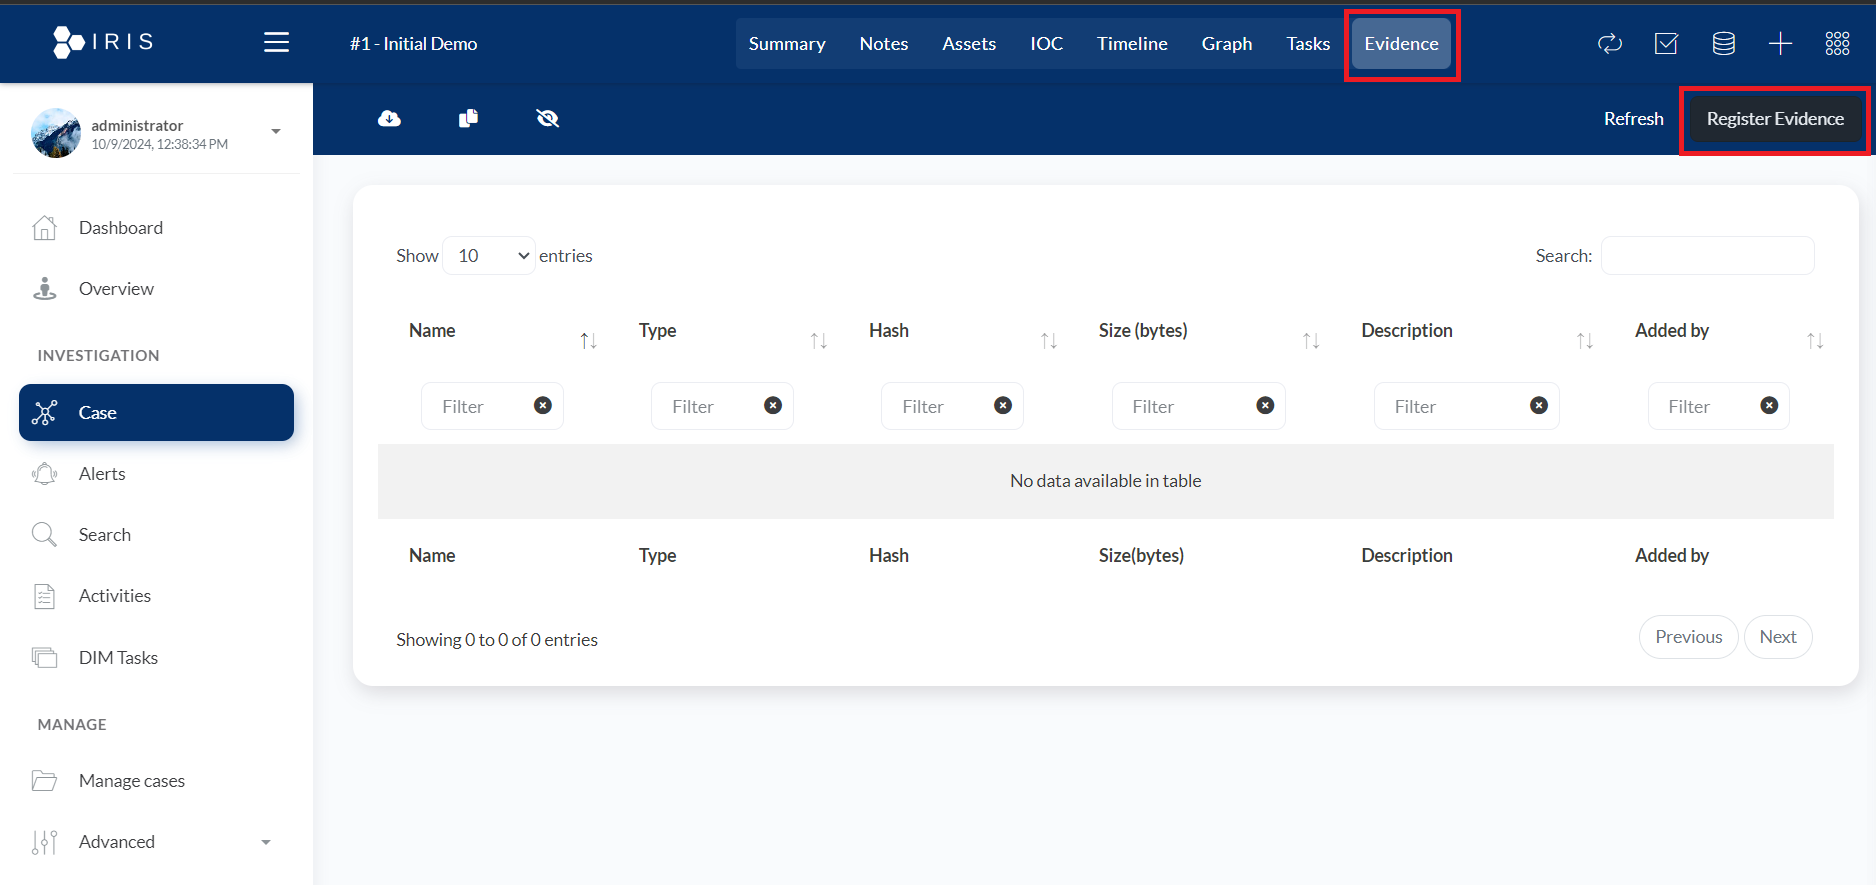
- Register Evidence button: This button allows users to add new evidence to the system. When clicked, it likely opens a form where users can input details about the evidence, such as file name, type, hash, size, and more.
- Evidence table:
- Name: The name of the evidence item, which could be a file, document, or other material relevant to the investigation.
- Type: The type or category of evidence, such as files, logs, or other artifacts.
- Hash: A unique hash value (e.g., MD5, SHA256) to ensure evidence integrity and authenticity.
- Size (bytes): The size of the evidence file in bytes, useful for identifying large datasets or files.
- Description: A detailed description of the evidence, giving context to its relevance in the investigation.
- Added by: The user who added the evidence, allowing for tracking and accountability.
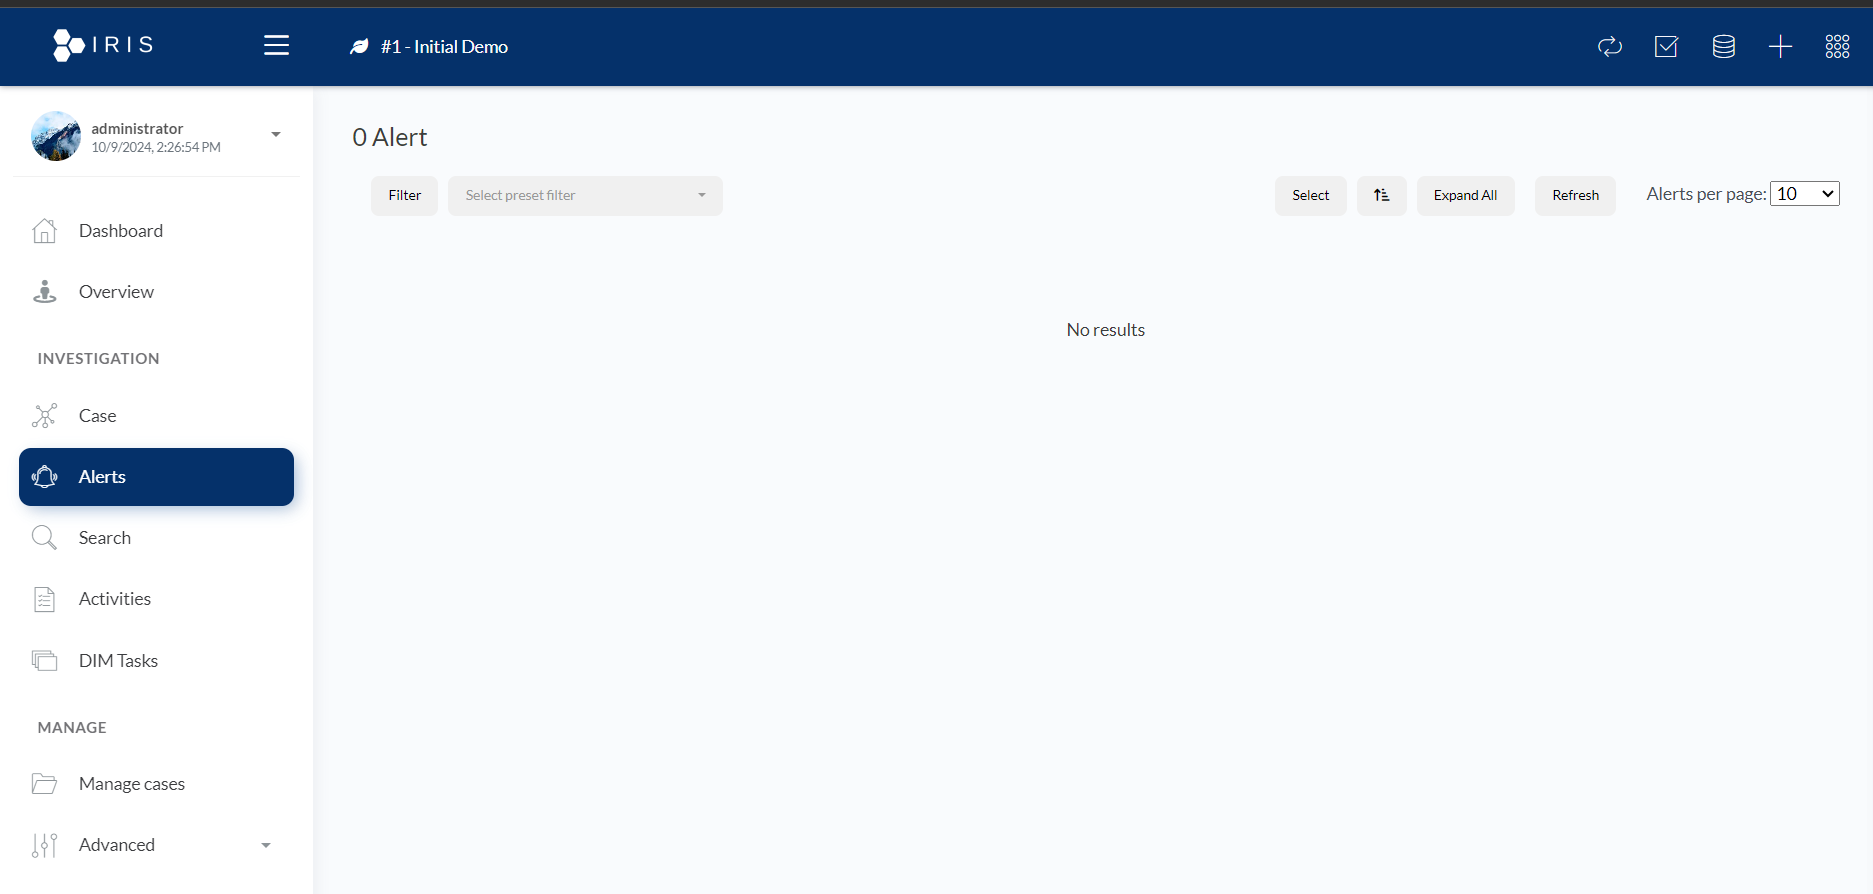
4. Alerts: Real-Time Threat Monitoring
- The Alerts module is where real-time detection happens. IRIS integrates with various security tools (like intrusion detection systems, firewalls, and antivirus solutions) to collect and centralize all alerts in one place.
- Key Functions:
- Alert Correlation: IRIS can correlate related alerts to help you identify patterns of attack. This reduces noise and helps focus on critical issues.
- Triage & Categorization: You can categorize alerts based on severity, type, and affected system, allowing for more efficient prioritization.
- Alert Automation: Set automated rules to escalate alerts into cases based on predefined criteria (e.g., a malware alert of high severity might automatically generate a case).
- Types of Alerts:
- Malware Detection: Identifies when malicious software attempts to execute on your network.
- Suspicious Network Activity: Tracks potential indicators of compromise (IOCs) such as unusual traffic or data exfiltration.
- Authentication Anomalies: Alerts you when there are suspicious login attempts, such as brute-force attacks or unusual access locations.
5. Search: Find What You Need Fast
- The Search functionality in DFIR IRIS is highly robust and can quickly return results across cases, alerts, logs, and tasks. This feature is especially useful when dealing with large-scale operations where incidents span across multiple systems and teams.
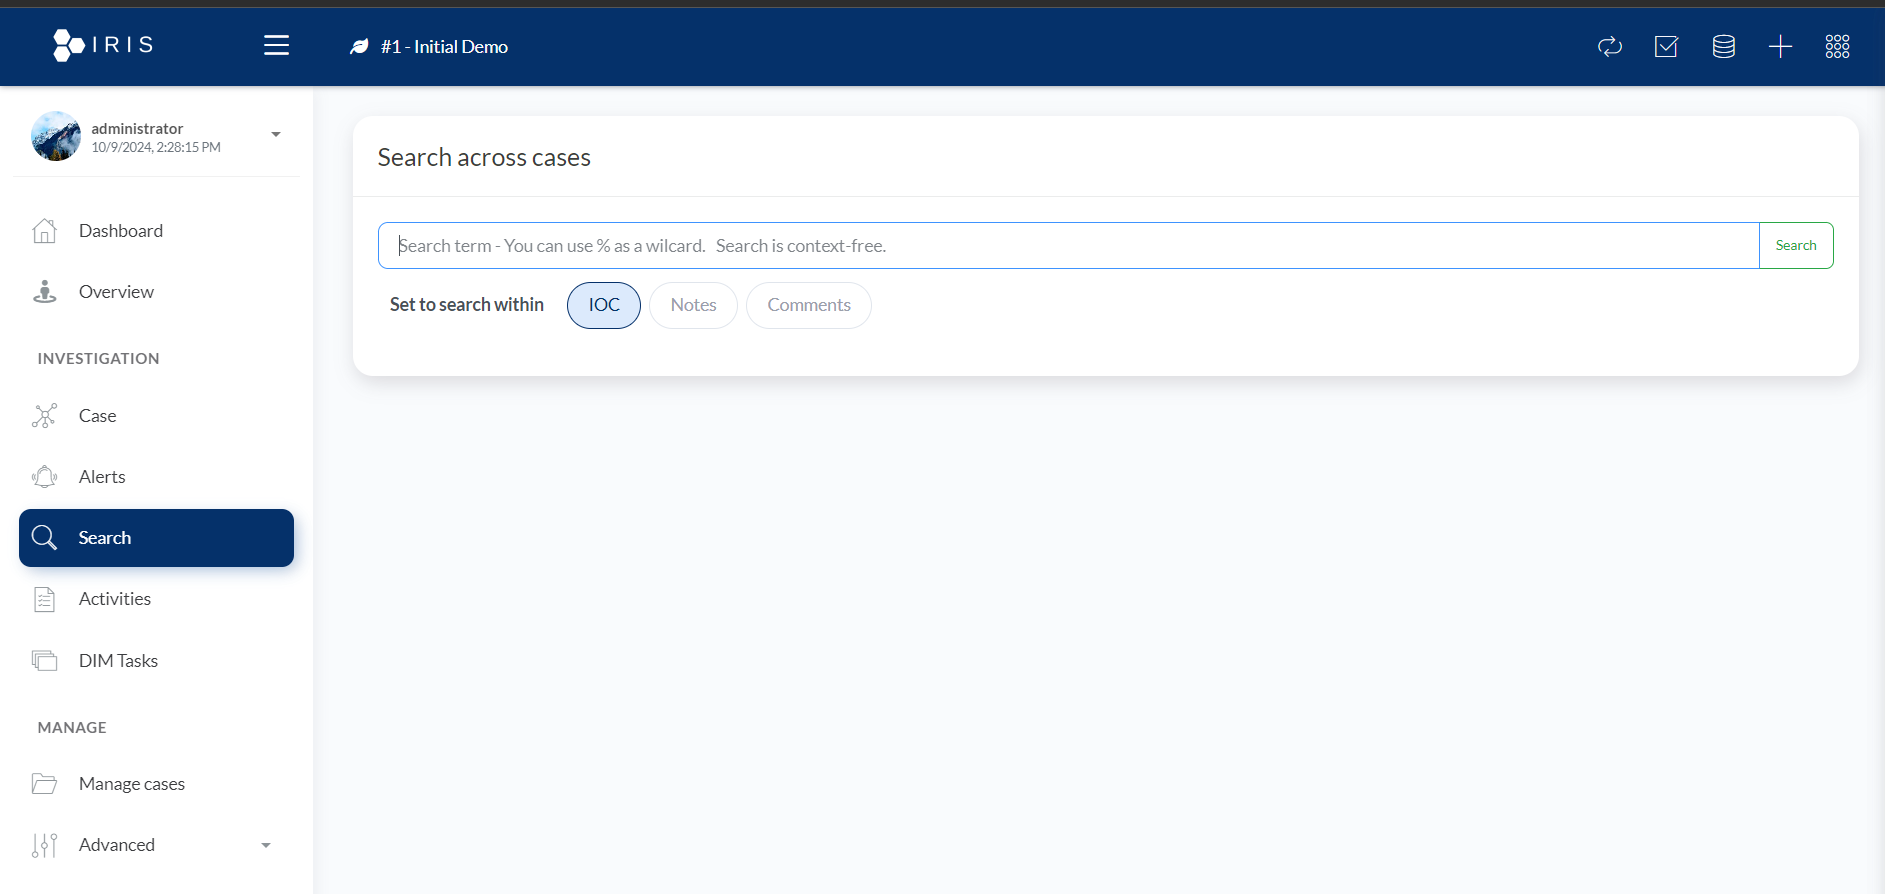
- Search Capabilities:
- Keyword Search: Input any keyword related to an alert, case, or task and the system will return matching results.
- Date Range Filters: Narrow down your search based on specific timeframes.
- Advanced Search: Apply multiple filters (e.g., severity, case owner, task status) to quickly locate relevant data.
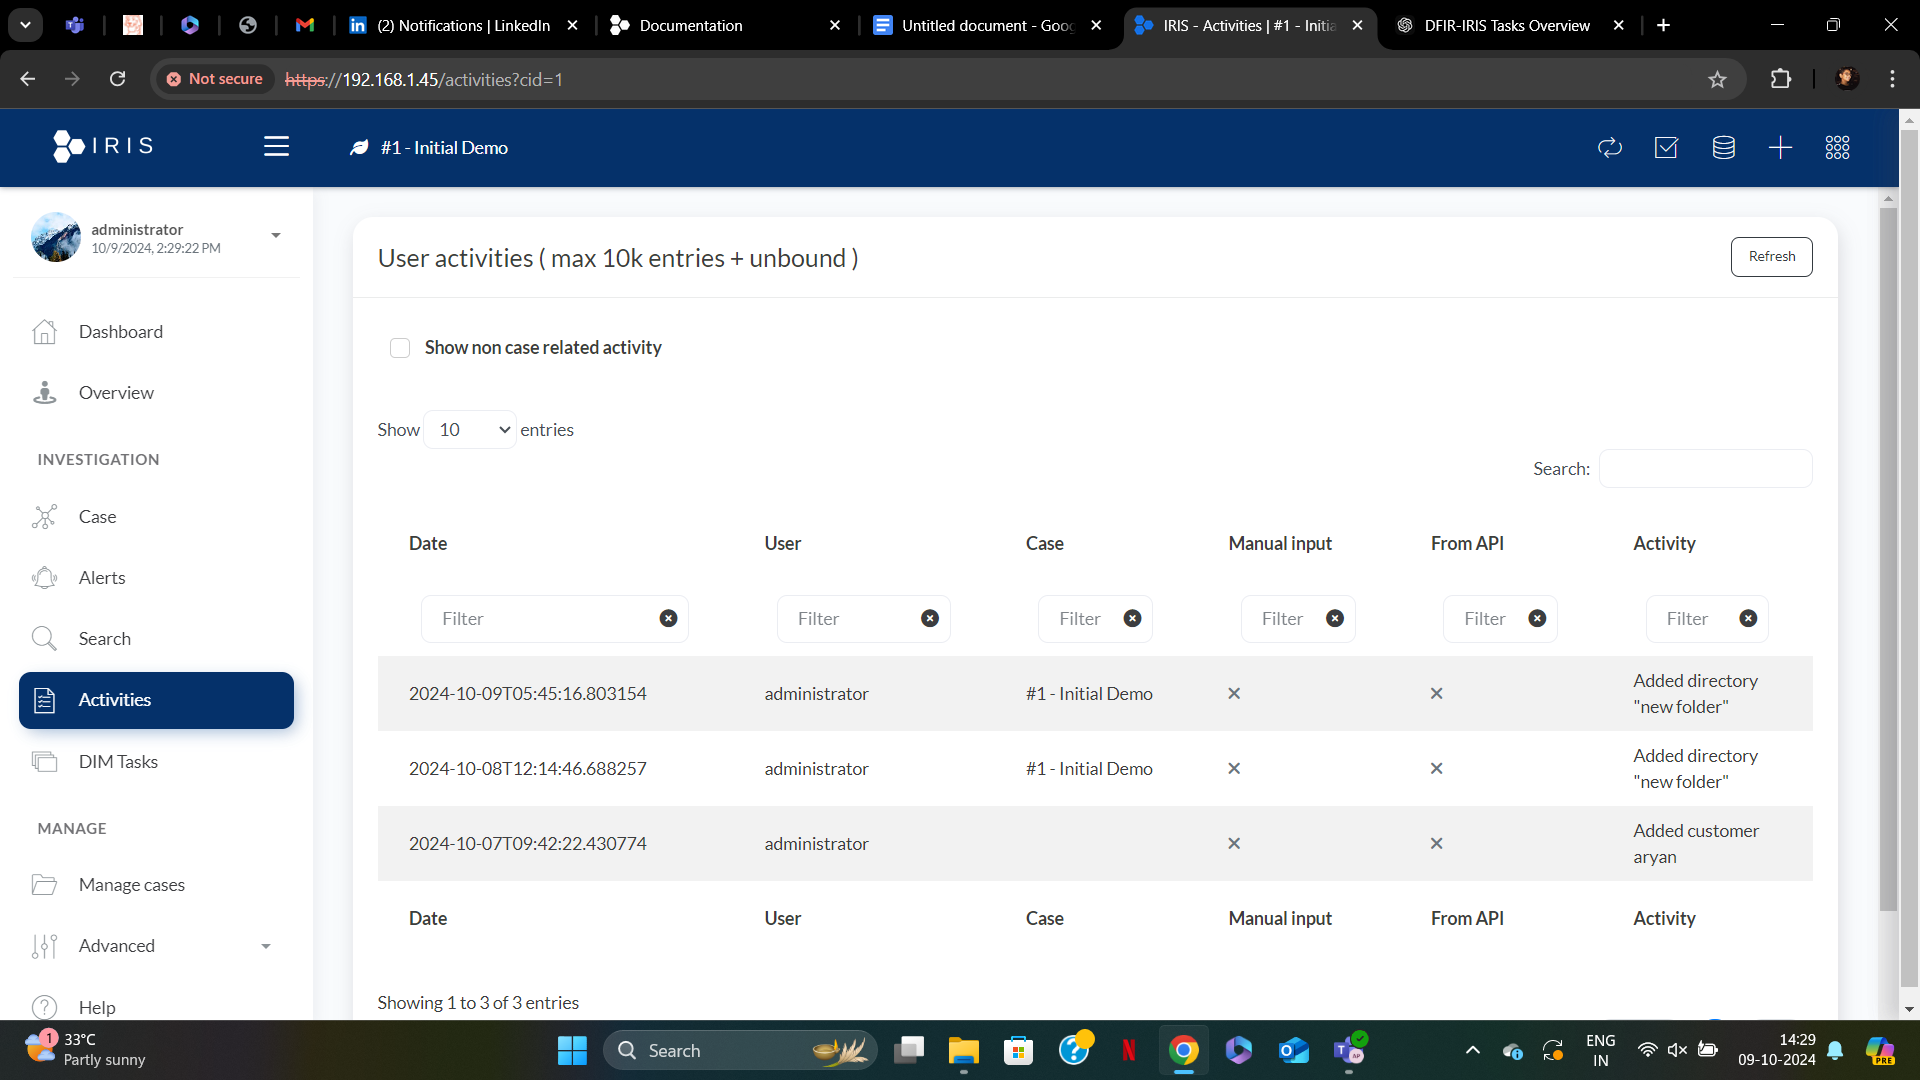
6. Activities: Tracking Team Movements
- The Activities module provides a full audit trail of user actions within DFIR IRIS. Whether you’re tracking evidence uploads, case updates, or alert reviews, this module ensures every move within the system is documented.
Key Features:
The Activity Table displays various logged activities by users. The columns in the table include:
- Date: The timestamp showing when the activity was performed, formatted down to milliseconds. This helps in keeping a precise record of when an action was taken.
- User: The username of the individual who performed the action. In this case, the user listed is administrator, showing which user initiated the activity.
- Case: This field indicates the specific case to which the activity is related. In the screenshot, the activities are associated with #1 - Initial Demo.
- Manual Input: This column indicates whether the activity was performed manually by the user. A checkmark "x" indicates that the action was not manually entered, but likely triggered by the system or automation.
- From API: This column indicates whether the activity was initiated via API. Like the manual input column, an "x" means the activity did not originate from an API.
- Activity: The specific action taken, such as "Added directory 'new folder'" or "Added customer aryan." This column describes what was done by the user.
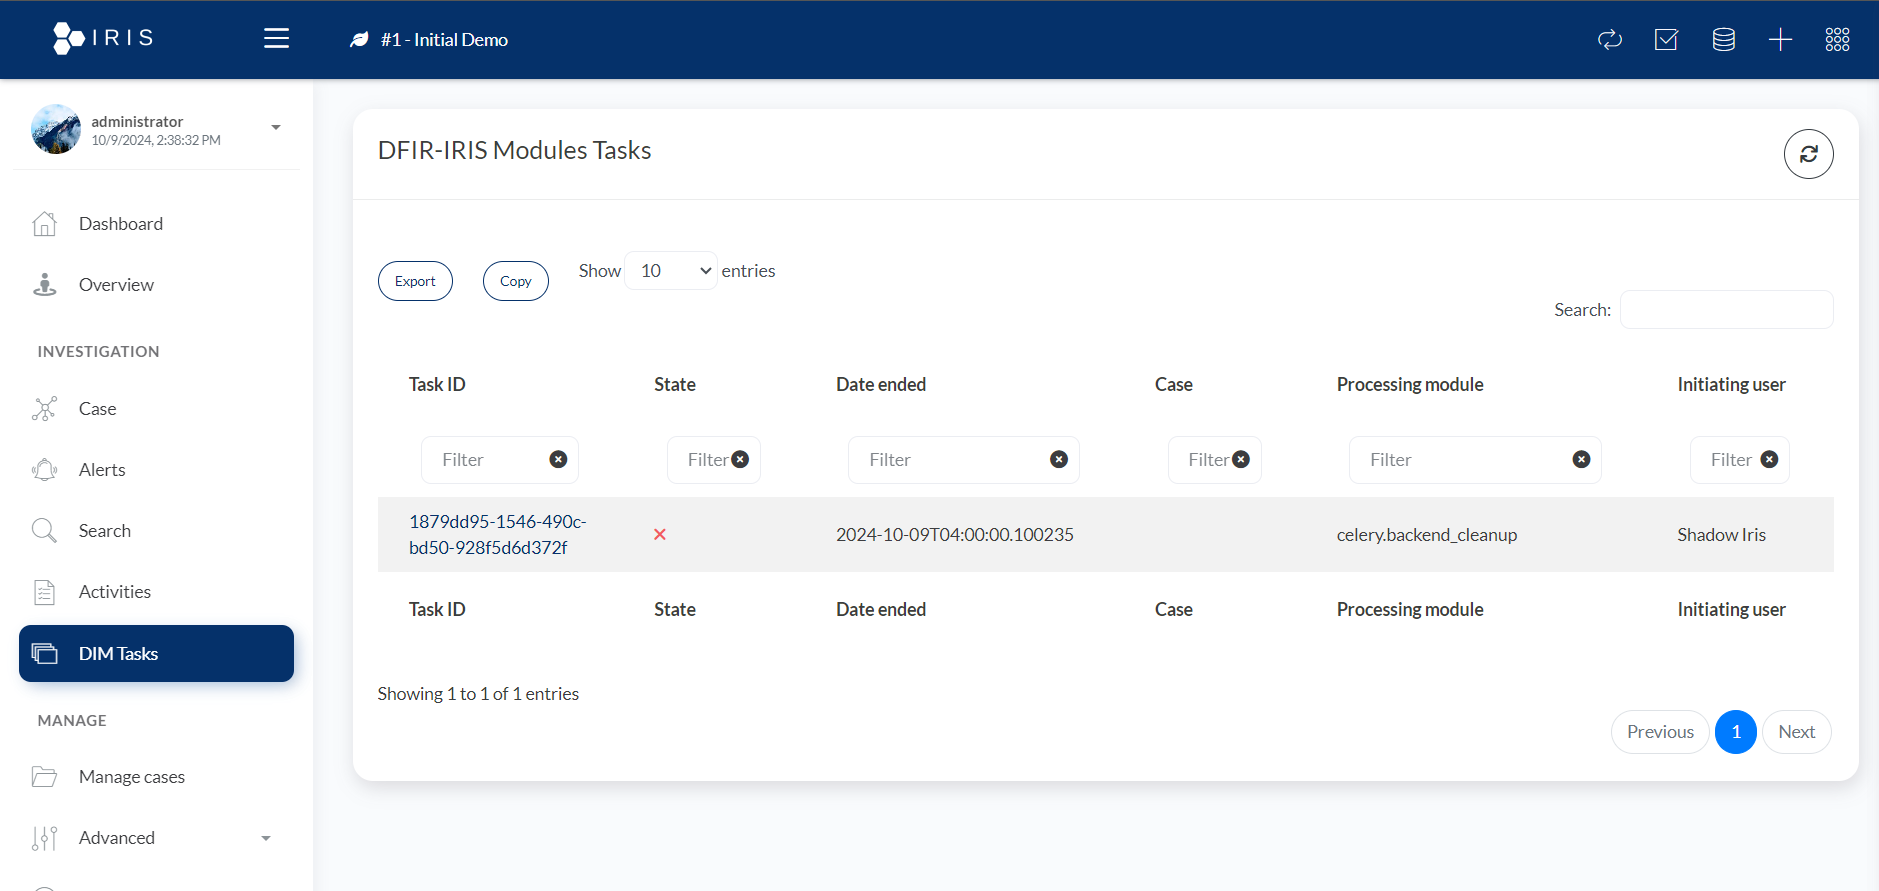
7. DIM Tasks: Coordinating Team Efforts
- Digital Investigation Management (DIM) Tasks allow you to break down investigations into smaller, manageable actions that can be assigned to individual team members. This keeps everyone on track and ensures that no steps are missed.
- Detailed Task Features:
- Task ID:
- This is the unique identifier for the task. In the image, one such ID is 1879dd95-1546-490c-bd50-928f5d6d372f. Each task in DFIR-IRIS gets a unique ID for tracking and management purposes.
- State:
- This column indicates the current status of the task. In the provided screenshot, the task has a red cross (X), which likely means that the task has failed or encountered an error during execution.
- Date Ended:
- This shows the timestamp when the task was completed (or failed, as indicated by the state). The date and time format here is YYYY-MM-DDTHH:MM:SS.ssssss. For example, the task in the screenshot ended at 2024-10-09T04:00:00.100235.
- Case:
- This column likely shows the case ID or case name associated with the task, although in the provided example, no specific case name is displayed.
- Processing Module:
- This indicates which module or service processed the task. In the screenshot, the task was processed by celery.backend_cleanup, which is a task management system that helps distribute tasks, likely for cleanup purposes in the backend.
- Initiating User:
- This shows the user or system that initiated the task. In this case, the task was initiated by "Shadow Iris," which could be an automated user or a system service responsible for running certain tasks within DFIR-IRIS.
- Task ID:
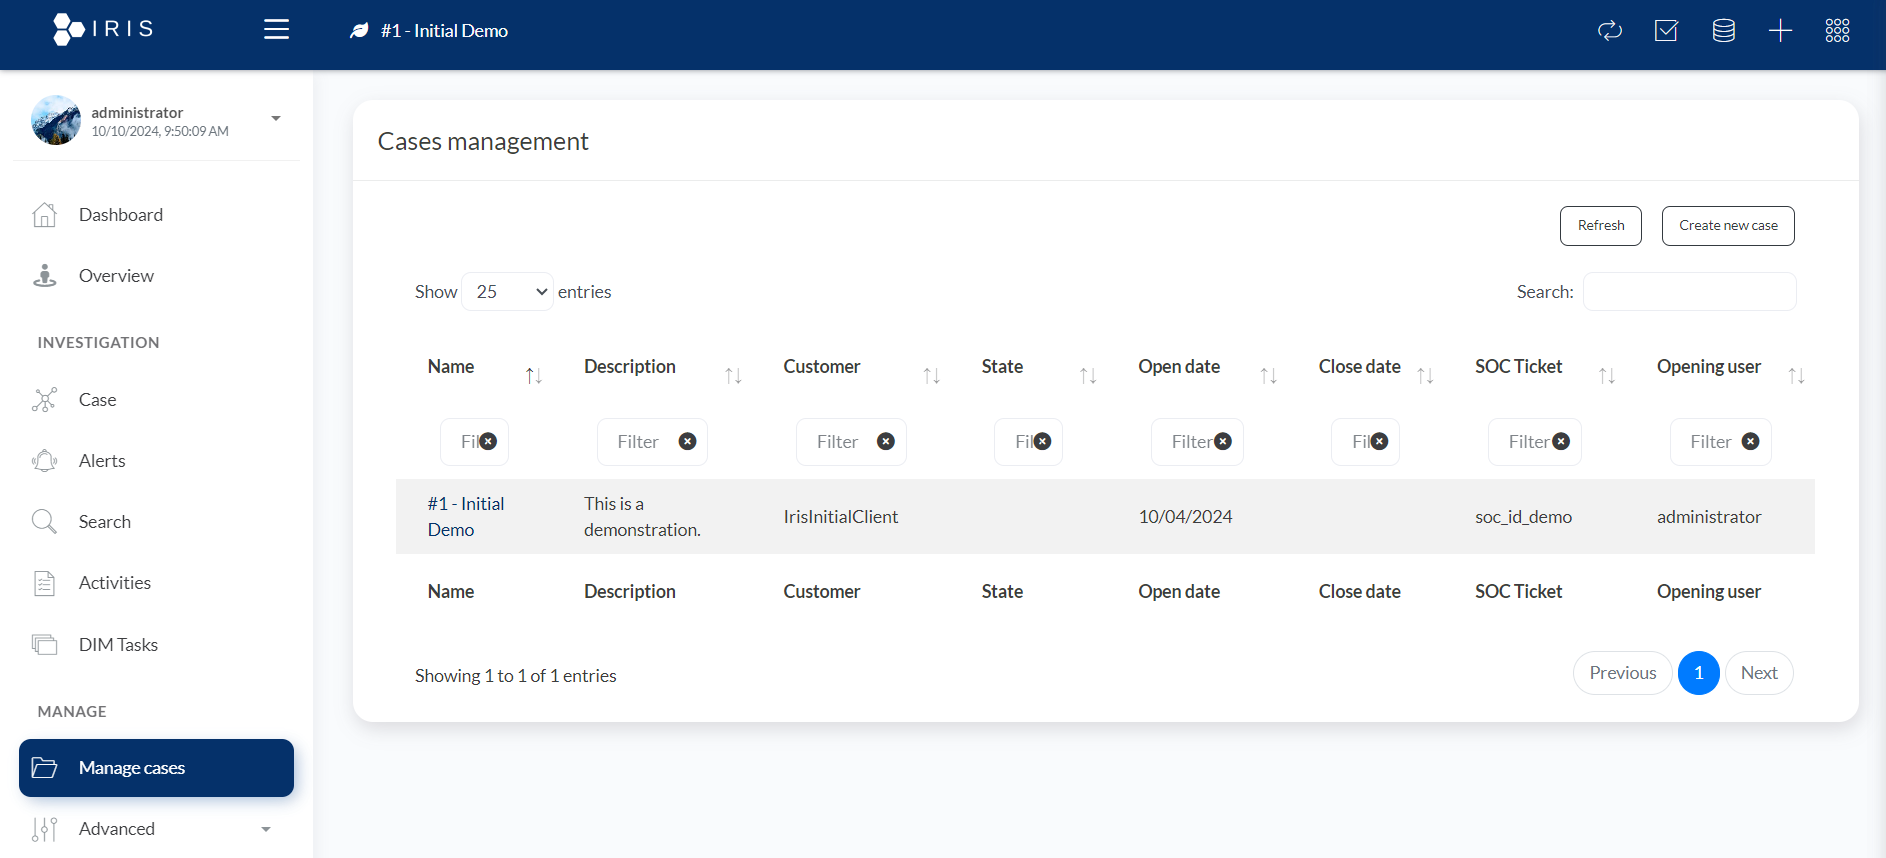
8. Case Management:
- The purpose of this section is to allow users to view, manage, and track different investigation cases related to incidents in the SOC. Each case can be tracked with detailed information such as its status, related SOC ticket, and other metadata.
- Key Features:
- Name:
- This column shows the unique name or identifier of the case. In the screenshot, the case is titled #1 - Initial Demo. This name is used to identify and differentiate between different cases.
- Description:
- A brief description of the case is provided here. The case in the screenshot is labeled with "This is a demonstration," which indicates that it might be a demo case or a sample case for testing purposes.
- Customer:
- This field identifies the customer associated with the case. In the example, the customer is IrisInitialClient, which could be a placeholder or demo client for the demonstration.
- State:
- The state represents the current status of the case (e.g., open, closed, or in progress). This allows users to understand the current position of each case in the investigation lifecycle.
- Open Date:
- This shows when the case was opened. In the example, the case was opened on 10/04/2024.
- Close Date:
- If a case is closed, this column displays when the case was resolved or closed. No close date is shown in the screenshot, indicating that the case is still open or ongoing.
- SOC Ticket:
- This column links to the associated SOC ticket that triggered or corresponds to the case. In the example, it is labeled as soc_id_demo, which is likely a demo ticket created for testing.
- Opening User:
- The user who opened or created the case is listed here. In the example, the administrator created the case.
- Name:
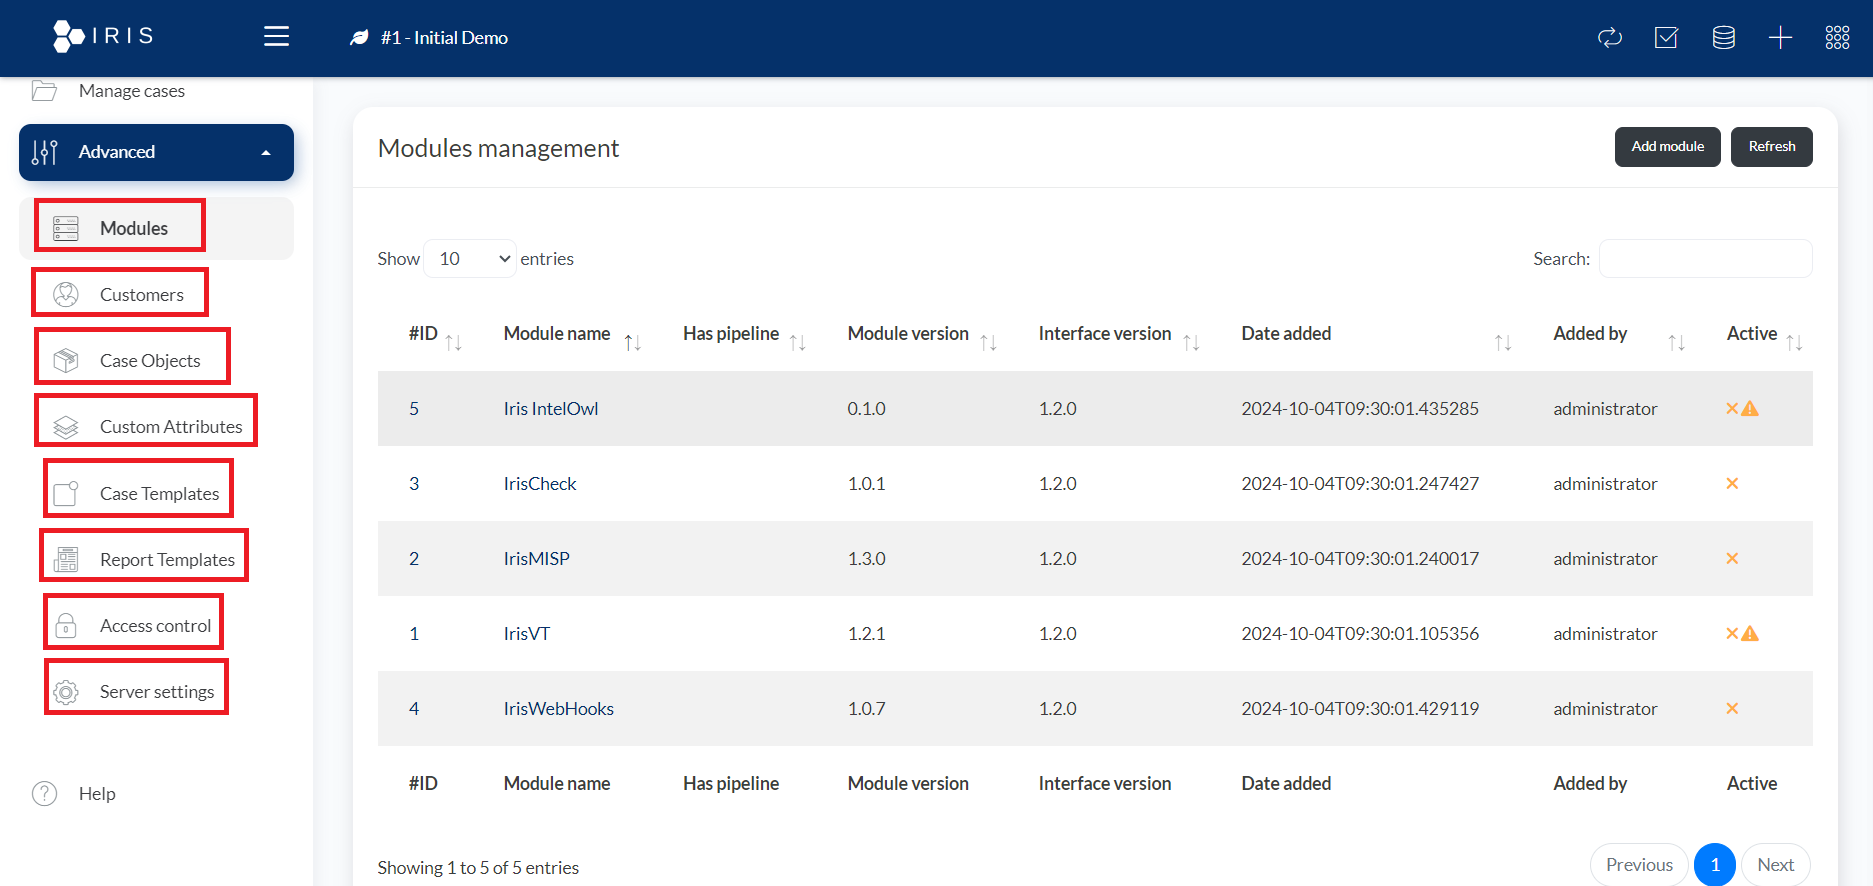
9. Advanced: System Configuration and Customization
- The "Advanced" section in DFIR-IRIS is designed to provide administrators and advanced users with the tools necessary to customize, manage, and extend the platform's capabilities. This section allows for advanced configuration, module management, and template creation, providing flexibility and control over how the platform operates for various investigation and response workflows.
Breakdown of the Key Features in the "Advanced" Section:
- Modules:
- This feature allows users to manage various modules within DFIR-IRIS. These modules can provide additional functionality or integrate external systems. For example, the screenshot shows several modules like Iris IntelOwl, IrisCheck, and IrisMISP.
- Users can view details such as module names, whether they have pipelines, version numbers, and who added them.
- Modules are critical for enhancing the platform’s capabilities, such as automating certain parts of the investigation process or connecting to threat intelligence services.
- Customers:
- This section is likely where the user can manage customer information or link cases to specific customers. In a multi-client environment, this would be essential for keeping track of which cases belong to which customers.
- Case Objects:
- Case Objects refer to entities related to cases, such as evidence, indicators, or files. This section may allow users to manage and track these objects associated with investigations.
- Custom Attributes:
- DFIR-IRIS allows users to define custom attributes for cases or objects, which helps tailor the platform to specific needs. Custom attributes can add additional metadata or information fields to cases, providing more flexibility in case management.
- Case Templates:
- This feature allows users to create and manage templates for cases. Templates are useful for standardizing the case creation process and ensuring consistency across different cases. This can be especially helpful for similar incidents or common scenarios that follow predefined workflows.
- Report Templates:
- Report Templates help automate the generation of investigation reports. These can include various details about the case, including findings, actions taken, and conclusions. By having templates, users can quickly generate consistent and professional reports for customers or internal use.
- Access Control:
- Access Control is vital for ensuring that the right users have appropriate access to the platform's different features and sections. Administrators can assign roles and permissions, limiting what certain users can do or see, based on their role in the SOC.
- Server Settings:
- The Server Settings section would typically allow configuration of backend settings, such as database connections, server performance parameters, and general platform configuration. This section is crucial for ensuring smooth operation and maintaining the stability of the DFIR-IRIS system.
- Modules:
10. Help: Learning Resources and Support
- The Help section is your go-to resource for documentation, FAQs, and support when using DFIR IRIS. Whether you’re stuck on a feature or just learning how to optimize your workflow, this module provides essential guidance.
Conclusion
- DFIR-IRIS is a robust, open-source platform designed to streamline incident response and digital forensics operations. By offering a highly customizable dashboard, efficient case management, and real-time alert monitoring, it simplifies complex cybersecurity incidents and supports comprehensive investigations. The system’s ability to integrate with various external tools, customize workflows, and automate tasks makes it a powerful solution for both small and large cybersecurity teams. Each module, from asset tracking to evidence management and automated alerting, ensures that incidents are managed in a structured, auditable manner, allowing teams to respond to threats more effectively. The platform’s flexibility and extensive feature set empower organizations to handle diverse security threats while maintaining control over the investigative process.
- With DFIR-IRIS, organizations can boost their incident response capabilities and enhance collaboration across teams, ensuring a more proactive approach to managing and mitigating cyber risks.
References
SOC Analyst with expertise in incident monitoring, Configuration wazuh-server. Holds a B.Tech degree from C.K. Pithawala.
Share