Understanding ELK Stack Essentials
Harsh Radadiya
Nov 23, 2024
•
10 Min
TABLE OF CONTENTS
Share

What is ELK Stack?
The ELK Stack was first introduced by Shay Banon in 2010 with the creation of Elasticsearch, which became the foundation of the stack. It was later expanded with the addition of Logstash and Kibana, forming the ELK trio. The stack is now owned and maintained by Elastic N.V., a company founded by Shay Banon in 2012 to support and develop the tools further.
The ELK Stack is a popular toolset used to collect, manage, and analyze logs and other types of data. It is made up of three main tools: Elasticsearch, Logstash, and Kibana. These tools work together to help you understand your data better.
Elasticsearch is like a super-smart search engine that stores all your data and makes it easy to find what you need. Logstash acts like a data collector and organizer, taking data from various sources, cleaning it up, and sending it to Elasticsearch. Kibana is the visual part of the stack, allowing you to create colorful dashboards and charts to see your data clearly.
This stack is widely used because it is open-source, meaning it’s free to use and easy to customize. Many companies use it to monitor their systems, track errors, and gain insights from their data in real time. It’s a powerful way to make sense of complex data and turn it into something useful and easy to understand.
Elasticsearch

Elasticsearch is a powerful tool designed to help you search, organize, and analyze data quickly and efficiently. It acts like a super-fast search engine, capable of handling all kinds of data, such as text, numbers, and logs. Imagine it as a smart librarian who can instantly find any information you need, even from massive collections of data.
One of the key features of Elasticsearch is its speed; it can process millions of records in seconds, making it ideal for tasks that require quick results.
Elasticsearch is not just about searching; it also helps you understand your data by analyzing trends, patterns, and behaviors, providing valuable insights.
Elasticsearch is scalable, capable of handling small projects for individuals or massive datasets for large businesses without any trouble.
Common use cases for Elasticsearch include:
- Powering search functions on websites.
- Monitoring systems for errors.
- Analyzing data for business decisions.
Elasticsearch is versatile and user-friendly, making it useful for businesses, data analysts, and IT teams alike.Its ability to process and analyze data in real-time makes it perfect for applications like:
- Monitoring website performance.
- Detecting errors in systems.
- Powering advanced search engines.
With its speed and scalability, Elasticsearch transforms how organizations handle and understand their data, providing smarter and faster solutions for modern needs.
Logstash

Logstash is designed for managing and processing logs or data from various sources. It acts as a pipeline that collects, processes, and sends data to locations like Elasticsearch or databases for storage or analysis. Logstash excels in environments requiring the management of large amounts of data from multiple sources, such as web servers, applications, or devices.
Data Collection:
- Logstash can gather data from diverse sources, including files, databases, and network devices.
- Its ability to pull data from different origins makes it highly flexible and useful for consolidating information into one place, providing a clearer picture of overall operations.
Data Processing:
- After data collection, Logstash processes the data to enhance its utility.
- It can clean messy data, rename fields, and add new information to make logs more meaningful.
- This ensures the data is in an easy-to-use format for its intended destination.
Data Output:
- Once processed, Logstash sends the data to its target destination, such as:
- Elasticsearch for analysis.
- A database for storage.
- Another monitoring tool.
- Its compatibility with multiple output systems makes it an essential component of the Elastic Stack.
Finally, Logstash sends the processed data to where it needs to go. This could be Elasticsearch for analysis, a database for storage, or even another tool for monitoring.
Its ability to work with many different output systems makes it an important part of the Elastic Stack, a popular suite of tools for data management and analysis.
In simple terms, Logstash helps you handle, clean, and move data so that it’s easier to understand and use. Whether you're dealing with logs from a website, an app, or network devices, Logstash makes managing that data much simpler and more efficient.
Kibana

A Kibana is a powerful data visualization tool that works with Elasticsearch to help you make sense of large amounts of data. Imagine having all your data organized and ready to explore through interactive charts, graphs, and dashboards.
Kibana gives you an easy way to do just that. It’s often used by teams to monitor systems, analyze trends, and detect issues, making it a valuable tool for businesses and developers.
Real-Time Data Visualization
- Allows you to see what’s happening as it happens.
- Example: If your website is receiving traffic from different parts of the world, Kibana can show you where the visitors are coming from on a live map.
- Especially useful for:
- Monitoring activities.
- Spotting unusual patterns in your data.
Advanced Search and Filtering
- Enables you to dig deeper into your data by:
- Searching for specific keywords.
- Applying filters to narrow down your results.
- Makes it easy to find the exact information you need, even with millions of data points.
For cybersecurity and IT professionals, Kibana is a go-to tool for analyzing logs and identifying potential security threats. By visualizing server logs, error reports, or even user activity, you can quickly identify problems and fix them before they escalate.
Overall, Kibana is like a magnifying glass for your data, helping you to not just see the big picture but also to zoom into the details that matter the most. It’s user-friendly, highly flexible, and an essential tool for anyone working with data or system monitoring.
Beats

Beats is a lightweight data shipper in the ELK Stack ecosystem. It works like a small helper that collects and sends data from your systems to Elasticsearch or Logstash.
Each Beat is designed to handle specific types of data, making it a modular and efficient way to gather information from different parts of your system.
Types of Beats :
- Filebeat: Collects log files.
- Metricbeat: Gathers system metrics like CPU and memory usage.
- Packetbeat: Focuses on network traffic.
These Beats are installed on your servers or devices to act as agents that send data to the ELK Stack for analysis and visualization.
One of the key advantages of Beats is its simplicity and efficiency. Since each Beat is lightweight, it doesn’t use a lot of system resources, ensuring your devices or servers can run smoothly while collecting data. This makes it ideal for large-scale setups where multiple systems are being monitored simultaneously.
Beats also integrates seamlessly with Logstash, where you can preprocess and transform the data before sending it to Elasticsearch. This adds flexibility, allowing you to clean and format the data as needed for better insights.
Kafka Server

Kafka is a powerful tool used alongside the ELK stack. Kafka comes into play as a messenger between different parts of a system. Imagine it as a postal service that delivers data from one place to another. In the context of the ELK stack, Kafka sits between the data sources and Logstash. It collects data from various places, like applications or servers, and streams it in real-time to where it needs to go.
By using Kafka with the ELK stack, data can be processed more smoothly and efficiently. Kafka handles large volumes of data without slowing down, which means information flows quickly from the source to Elasticsearch for indexing and then to Kibana for visualization.
The setup ensures that:
- Data is not lost.
- Data can be processed even if parts of the system are busy or temporarily down.
Moreover, Kafka adds flexibility to the ELK stack. Since it decouples data producers from consumers, you can add or change data sources without disrupting the whole system. This makes it easier to scale and adapt as your data needs grow.
In summary, Kafka acts as a reliable pipeline in the ELK stack, moving data swiftly and securely. It enhances the overall performance of the system, ensuring that data is always available for analysis and helping businesses make timely decisions based on real-time information.
How ELK Stack Works?

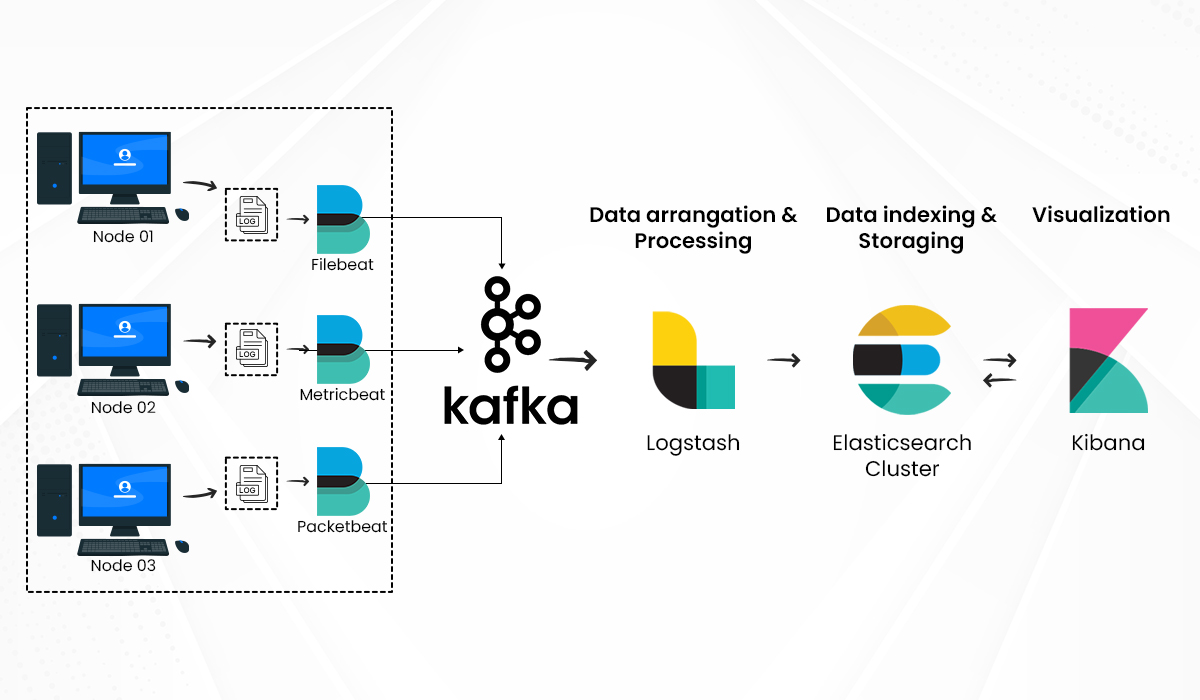
The ELK stack works as an efficient and powerful system for collecting, processing, and visualizing log data. It uses Beats, Kafka, Logstash, Elasticsearch, and Kibana in a collaborative workflow.
First, Beats acts as lightweight agents installed on servers or systems. These agents collect log data, metrics, or other system events and forward it to Kafka. Kafka is a message broker that ensures all data flows smoothly and can handle large volumes by queuing data before sending it further down the pipeline. This step helps manage scalability and reliability.
The collected data from Kafka is passed to Logstash. Logstash processes this data, performing filtering, enrichment, and transformation to make it suitable for analysis. It structures the data in a way that Elasticsearch can index and search efficiently.
Next, Elasticsearch stores the data in a distributed and scalable manner. It is a search engine capable of indexing and querying large amounts of data at high speed. The structured and indexed data is now ready for exploration and analysis.
Finally, Kibana is used to visualize and analyze this data interactively. It connects with Elasticsearch to create dashboards, graphs, and reports that help users make sense of the information. This end-to-end workflow provides insights into system performance and potential issues, empowering organizations to monitor and act effectively.
Use Cases
The ELK Stack is widely used in real-life scenarios to handle large amounts of data and make sense of it. One popular use case is in website performance monitoring. For example, e-commerce companies like Amazon use ELK to collect logs from their servers, track customer interactions, and monitor website performance. With this setup, they can instantly detect slow pages, errors, or unusual traffic spikes, ensuring customers have a seamless shopping experience.
Another common application is in cybersecurity. Companies like banks or financial institutions use ELK to analyze logs for suspicious activity or security breaches. For instance, if a bank detects multiple failed login attempts, ELK helps flag these incidents in real-time. Security teams can then act quickly to prevent potential fraud or data breaches.
ELK is also heavily used in application debugging by developers. A company building mobile apps might rely on ELK to collect logs from all users. For example, if a ride-hailing app like Uber faces crashes or glitches in certain regions, ELK can pinpoint the problem’s exact source by analyzing logs, helping developers fix the issue faster.
In IoT (Internet of Things) environments, ELK plays a big role too. For instance, a smart home company can use ELK to monitor millions of connected devices, such as smart thermostats or lights. If a specific model starts malfunctioning, ELK helps identify the problem through detailed error patterns in device logs.
Share


